What if pixels were part of a computer-driven color economy? What if they could freely trade their color with pixels of other colors? Jer Thorp's Colour Economy imagines an artificial economy of pixels, in which individual 'traders' exchange colors as a currency or commodity (read more, videos). While Jer's depictions show an evolution process between the trading pixels, we wanted to offer a macro-economic, snap-shot perspective where we visualize pixels as part of a nation (a color) and within each nation, being part of a state (defined by a hexadecimal value).
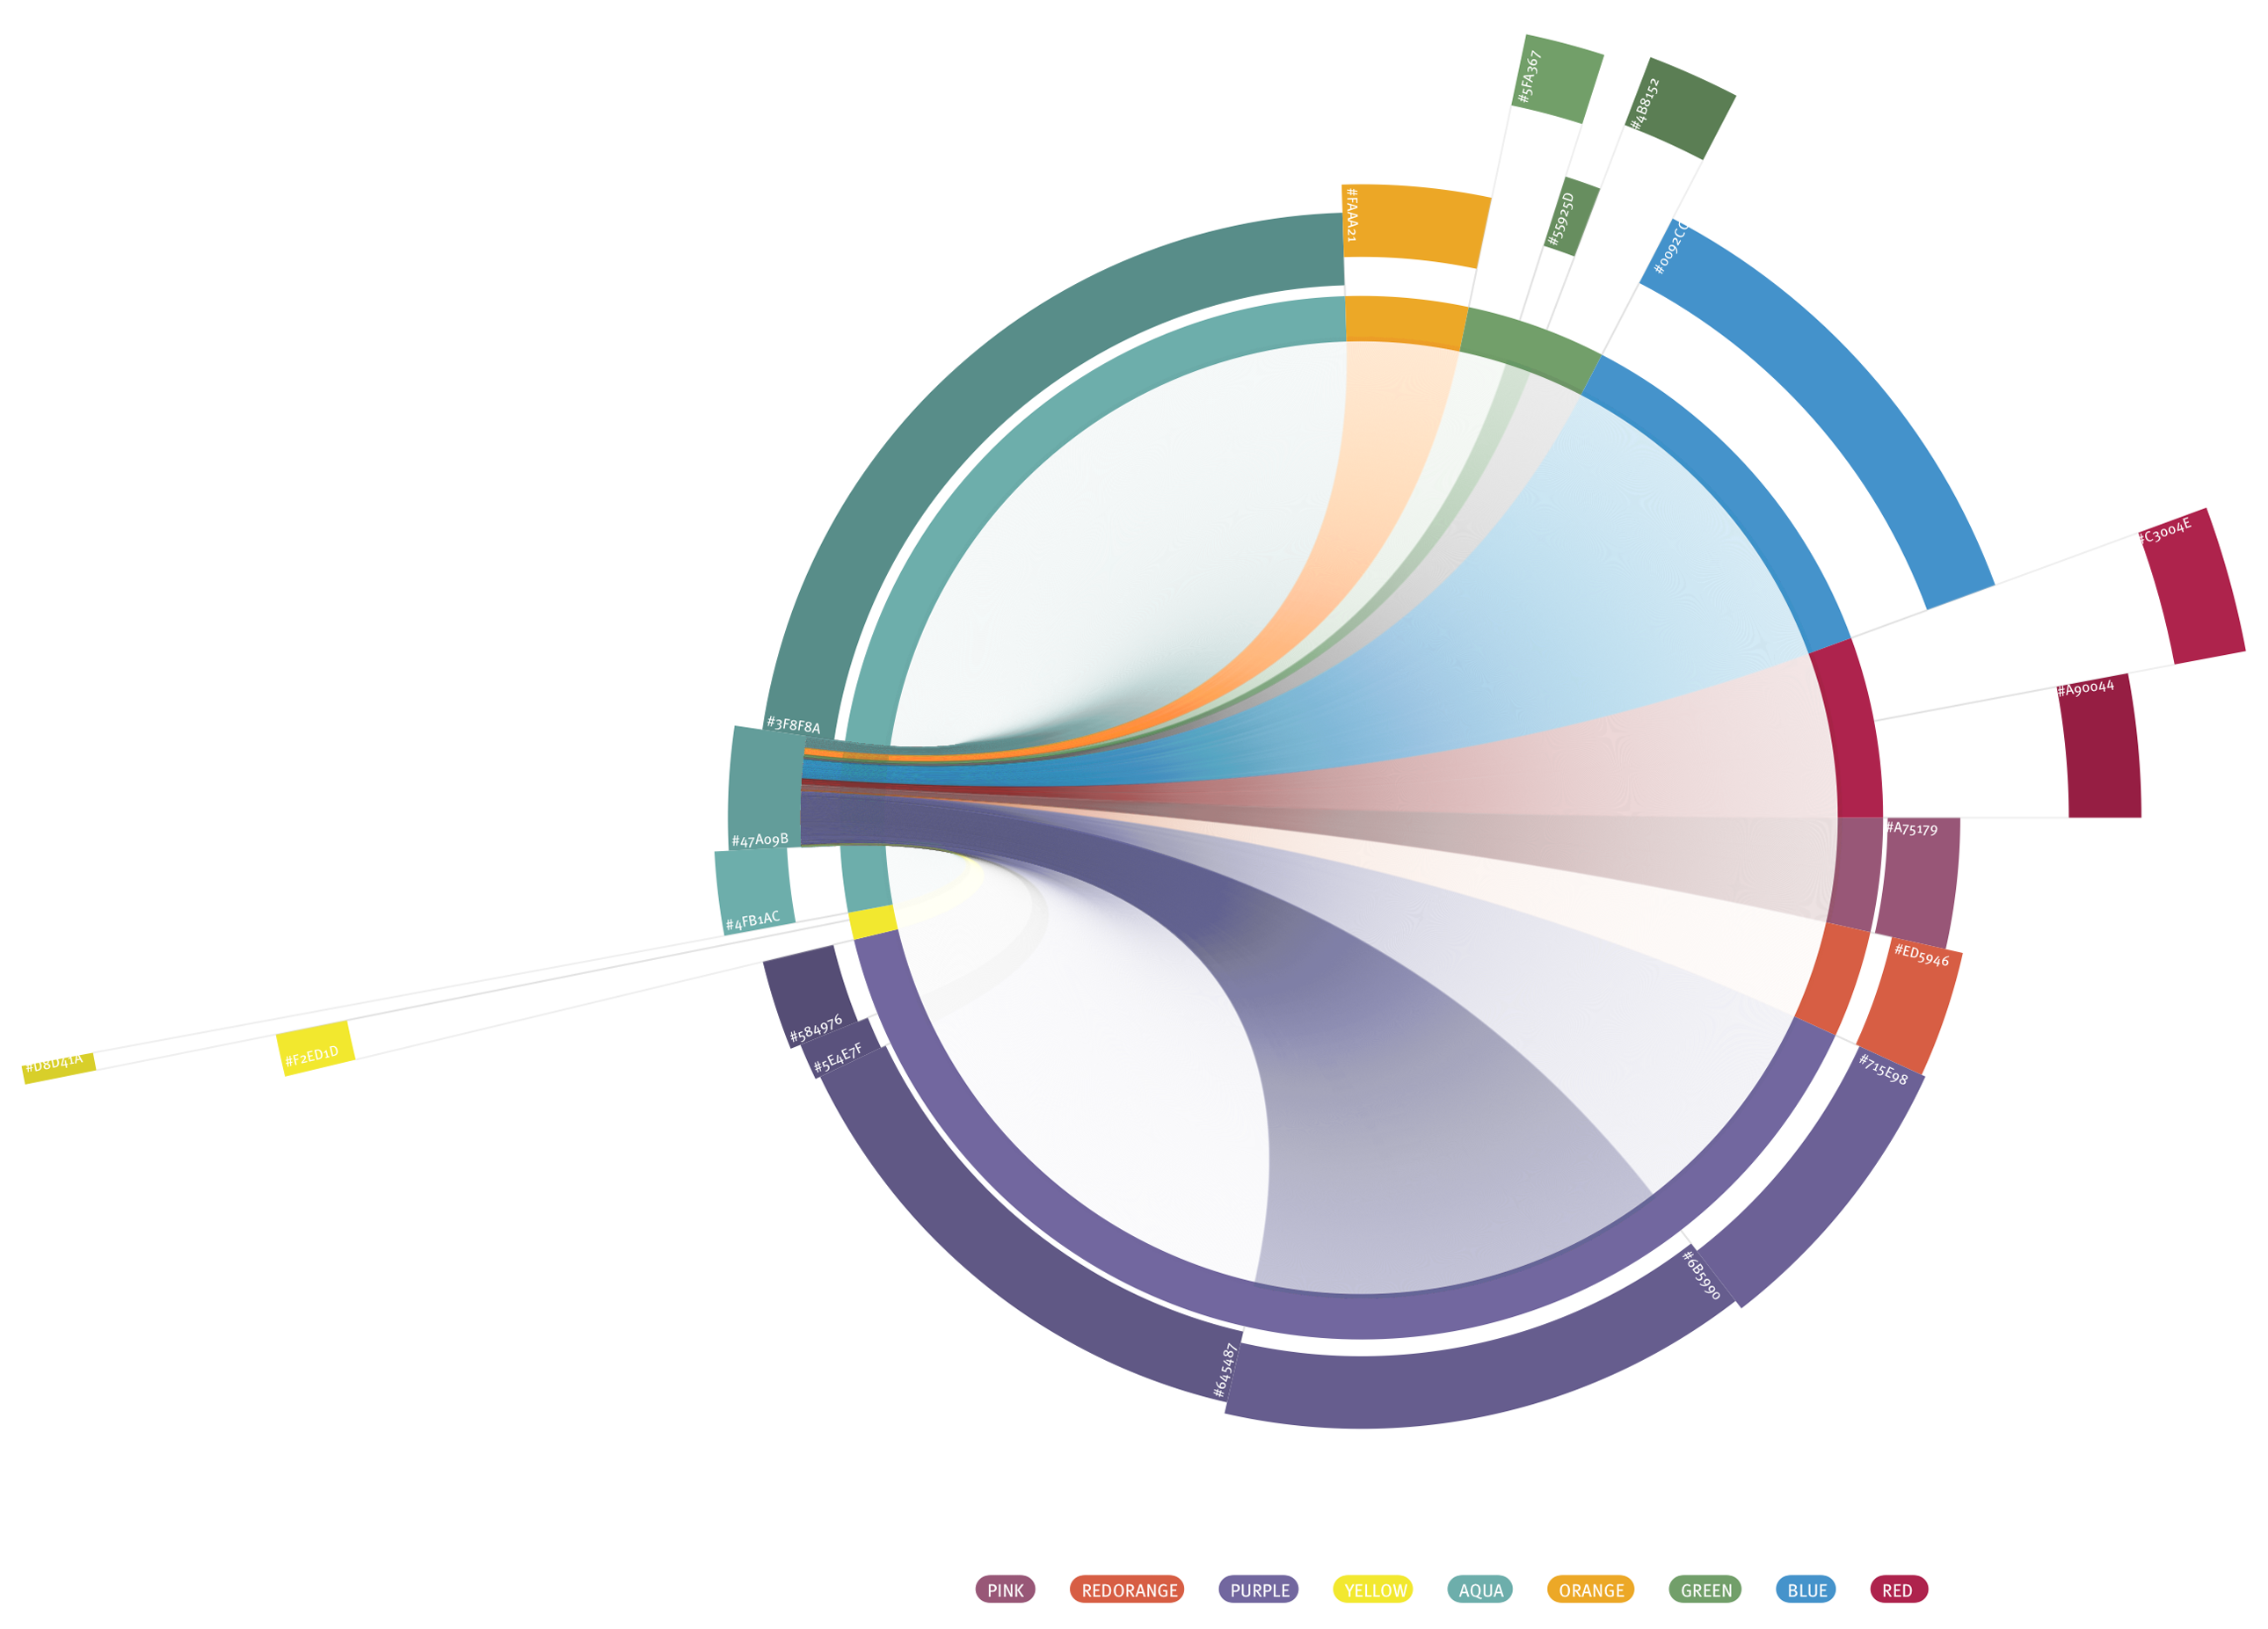
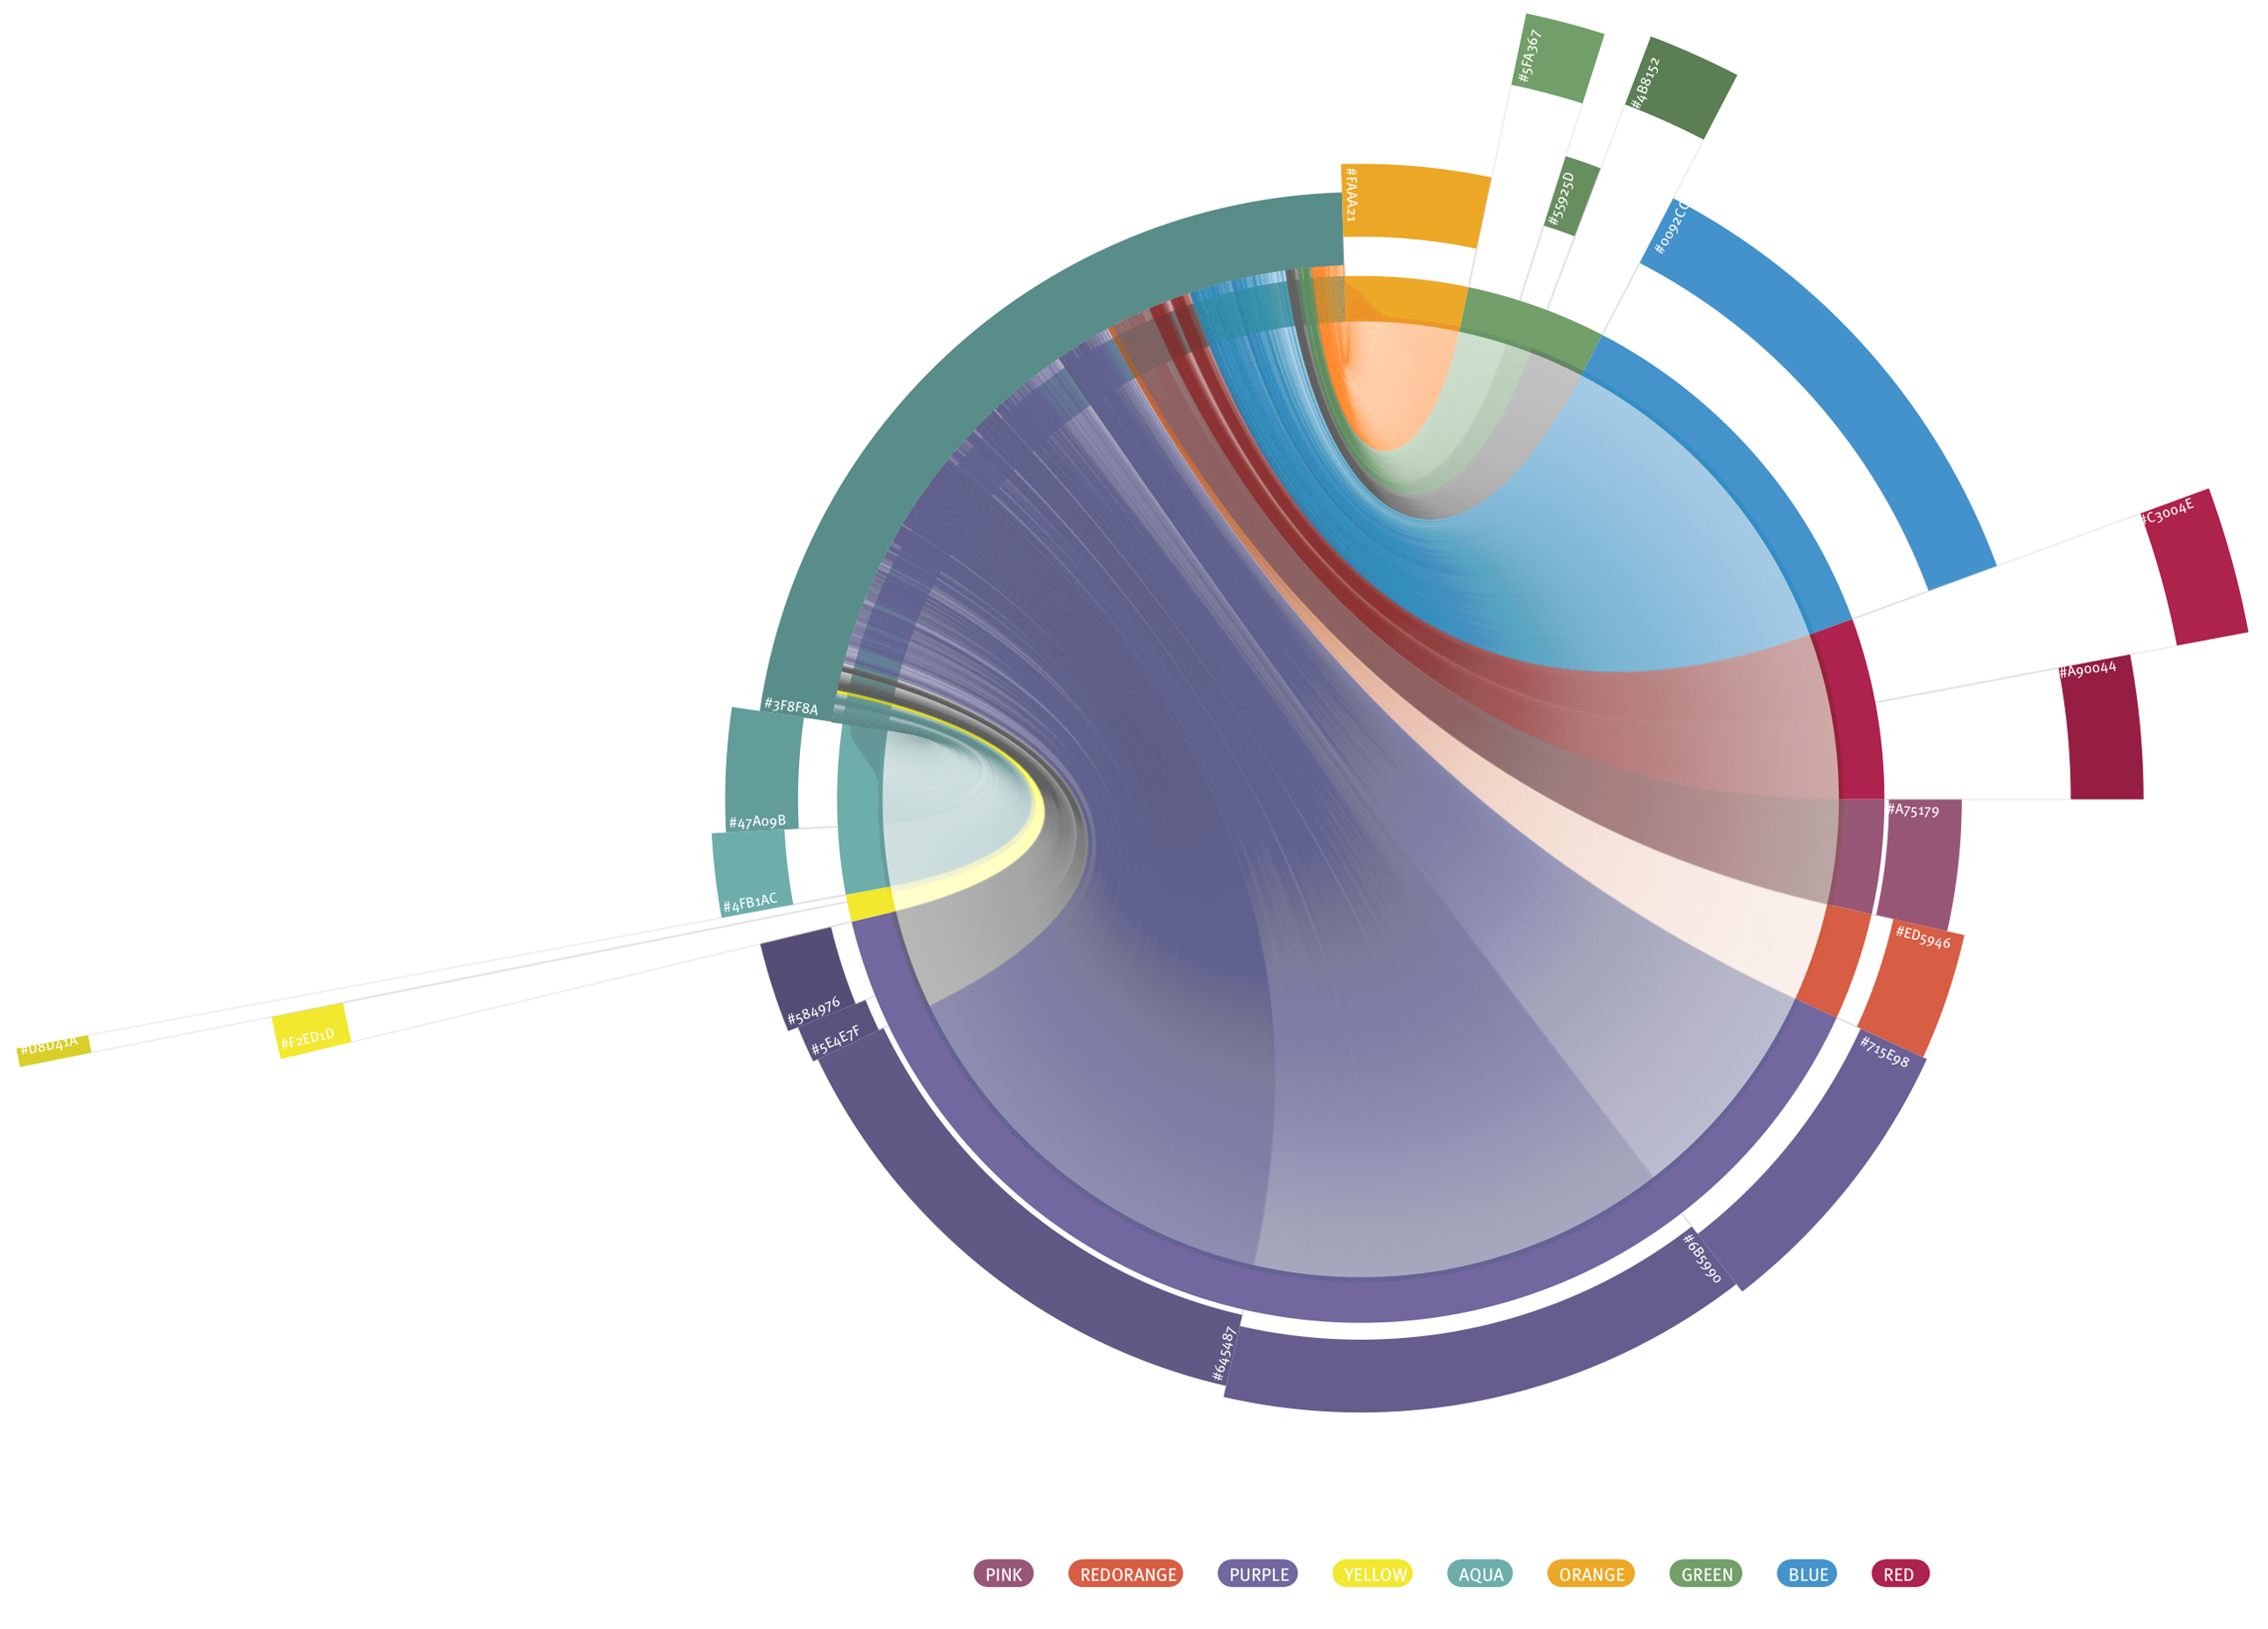
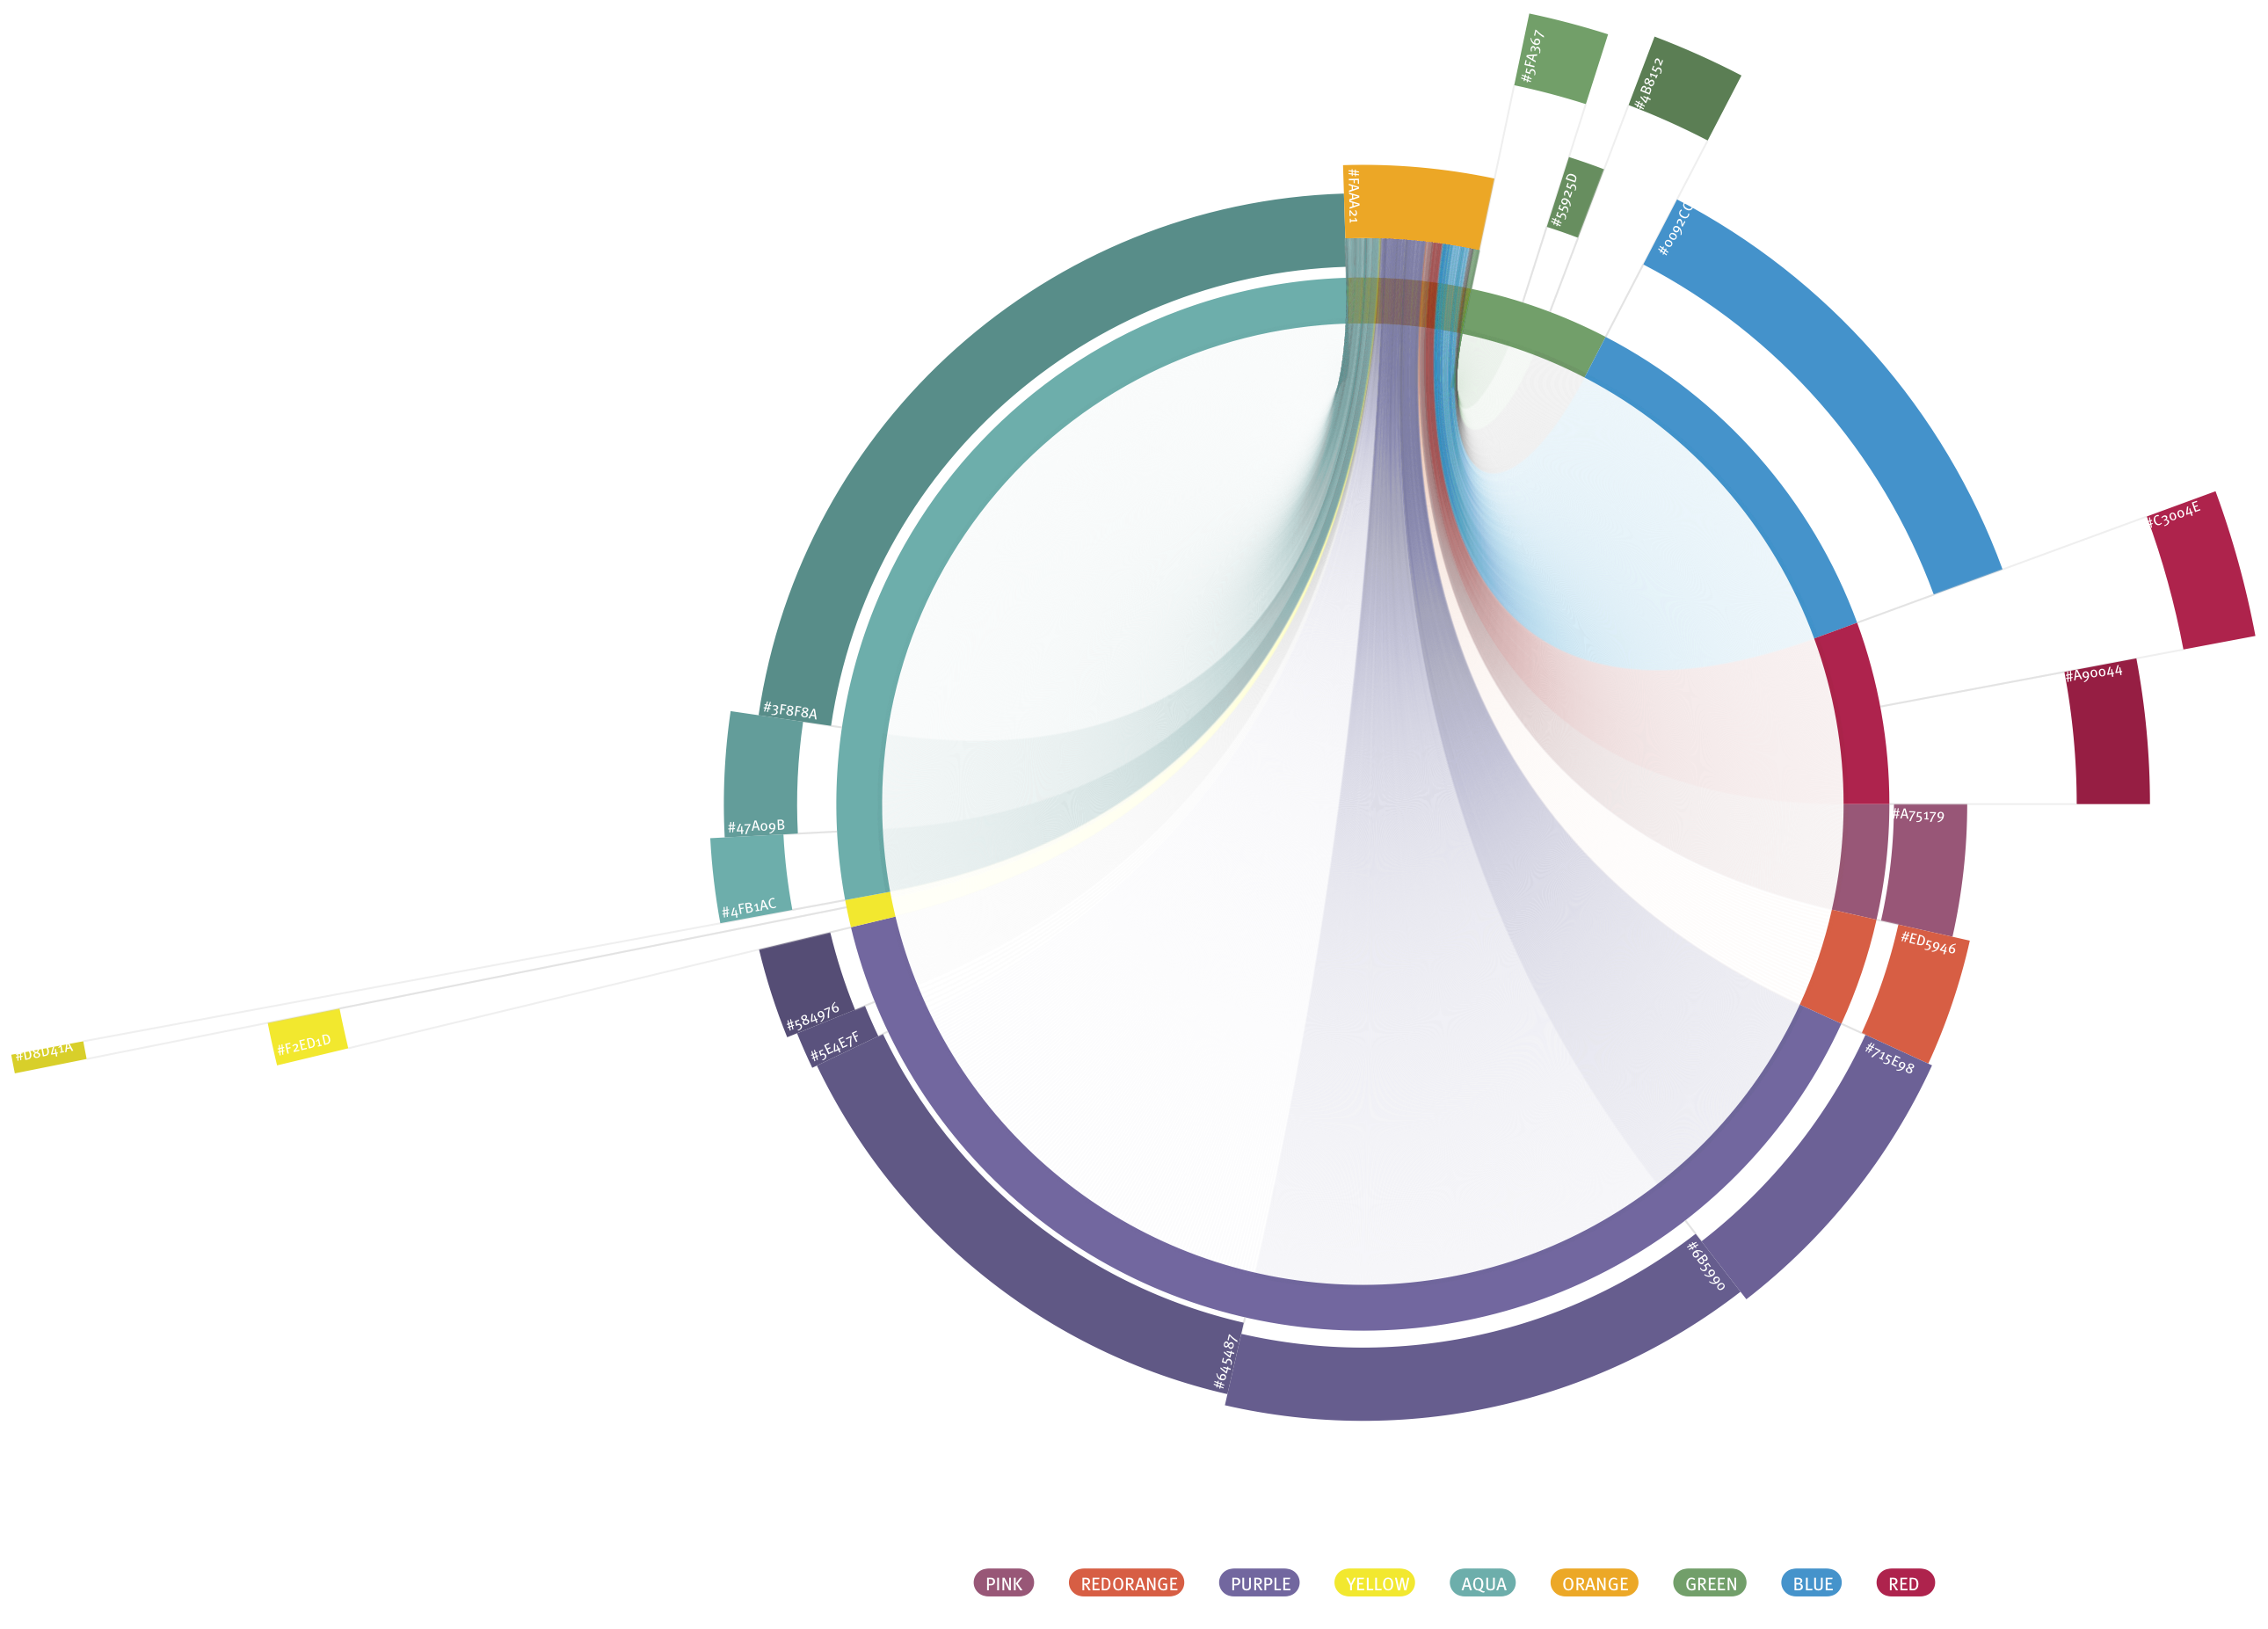
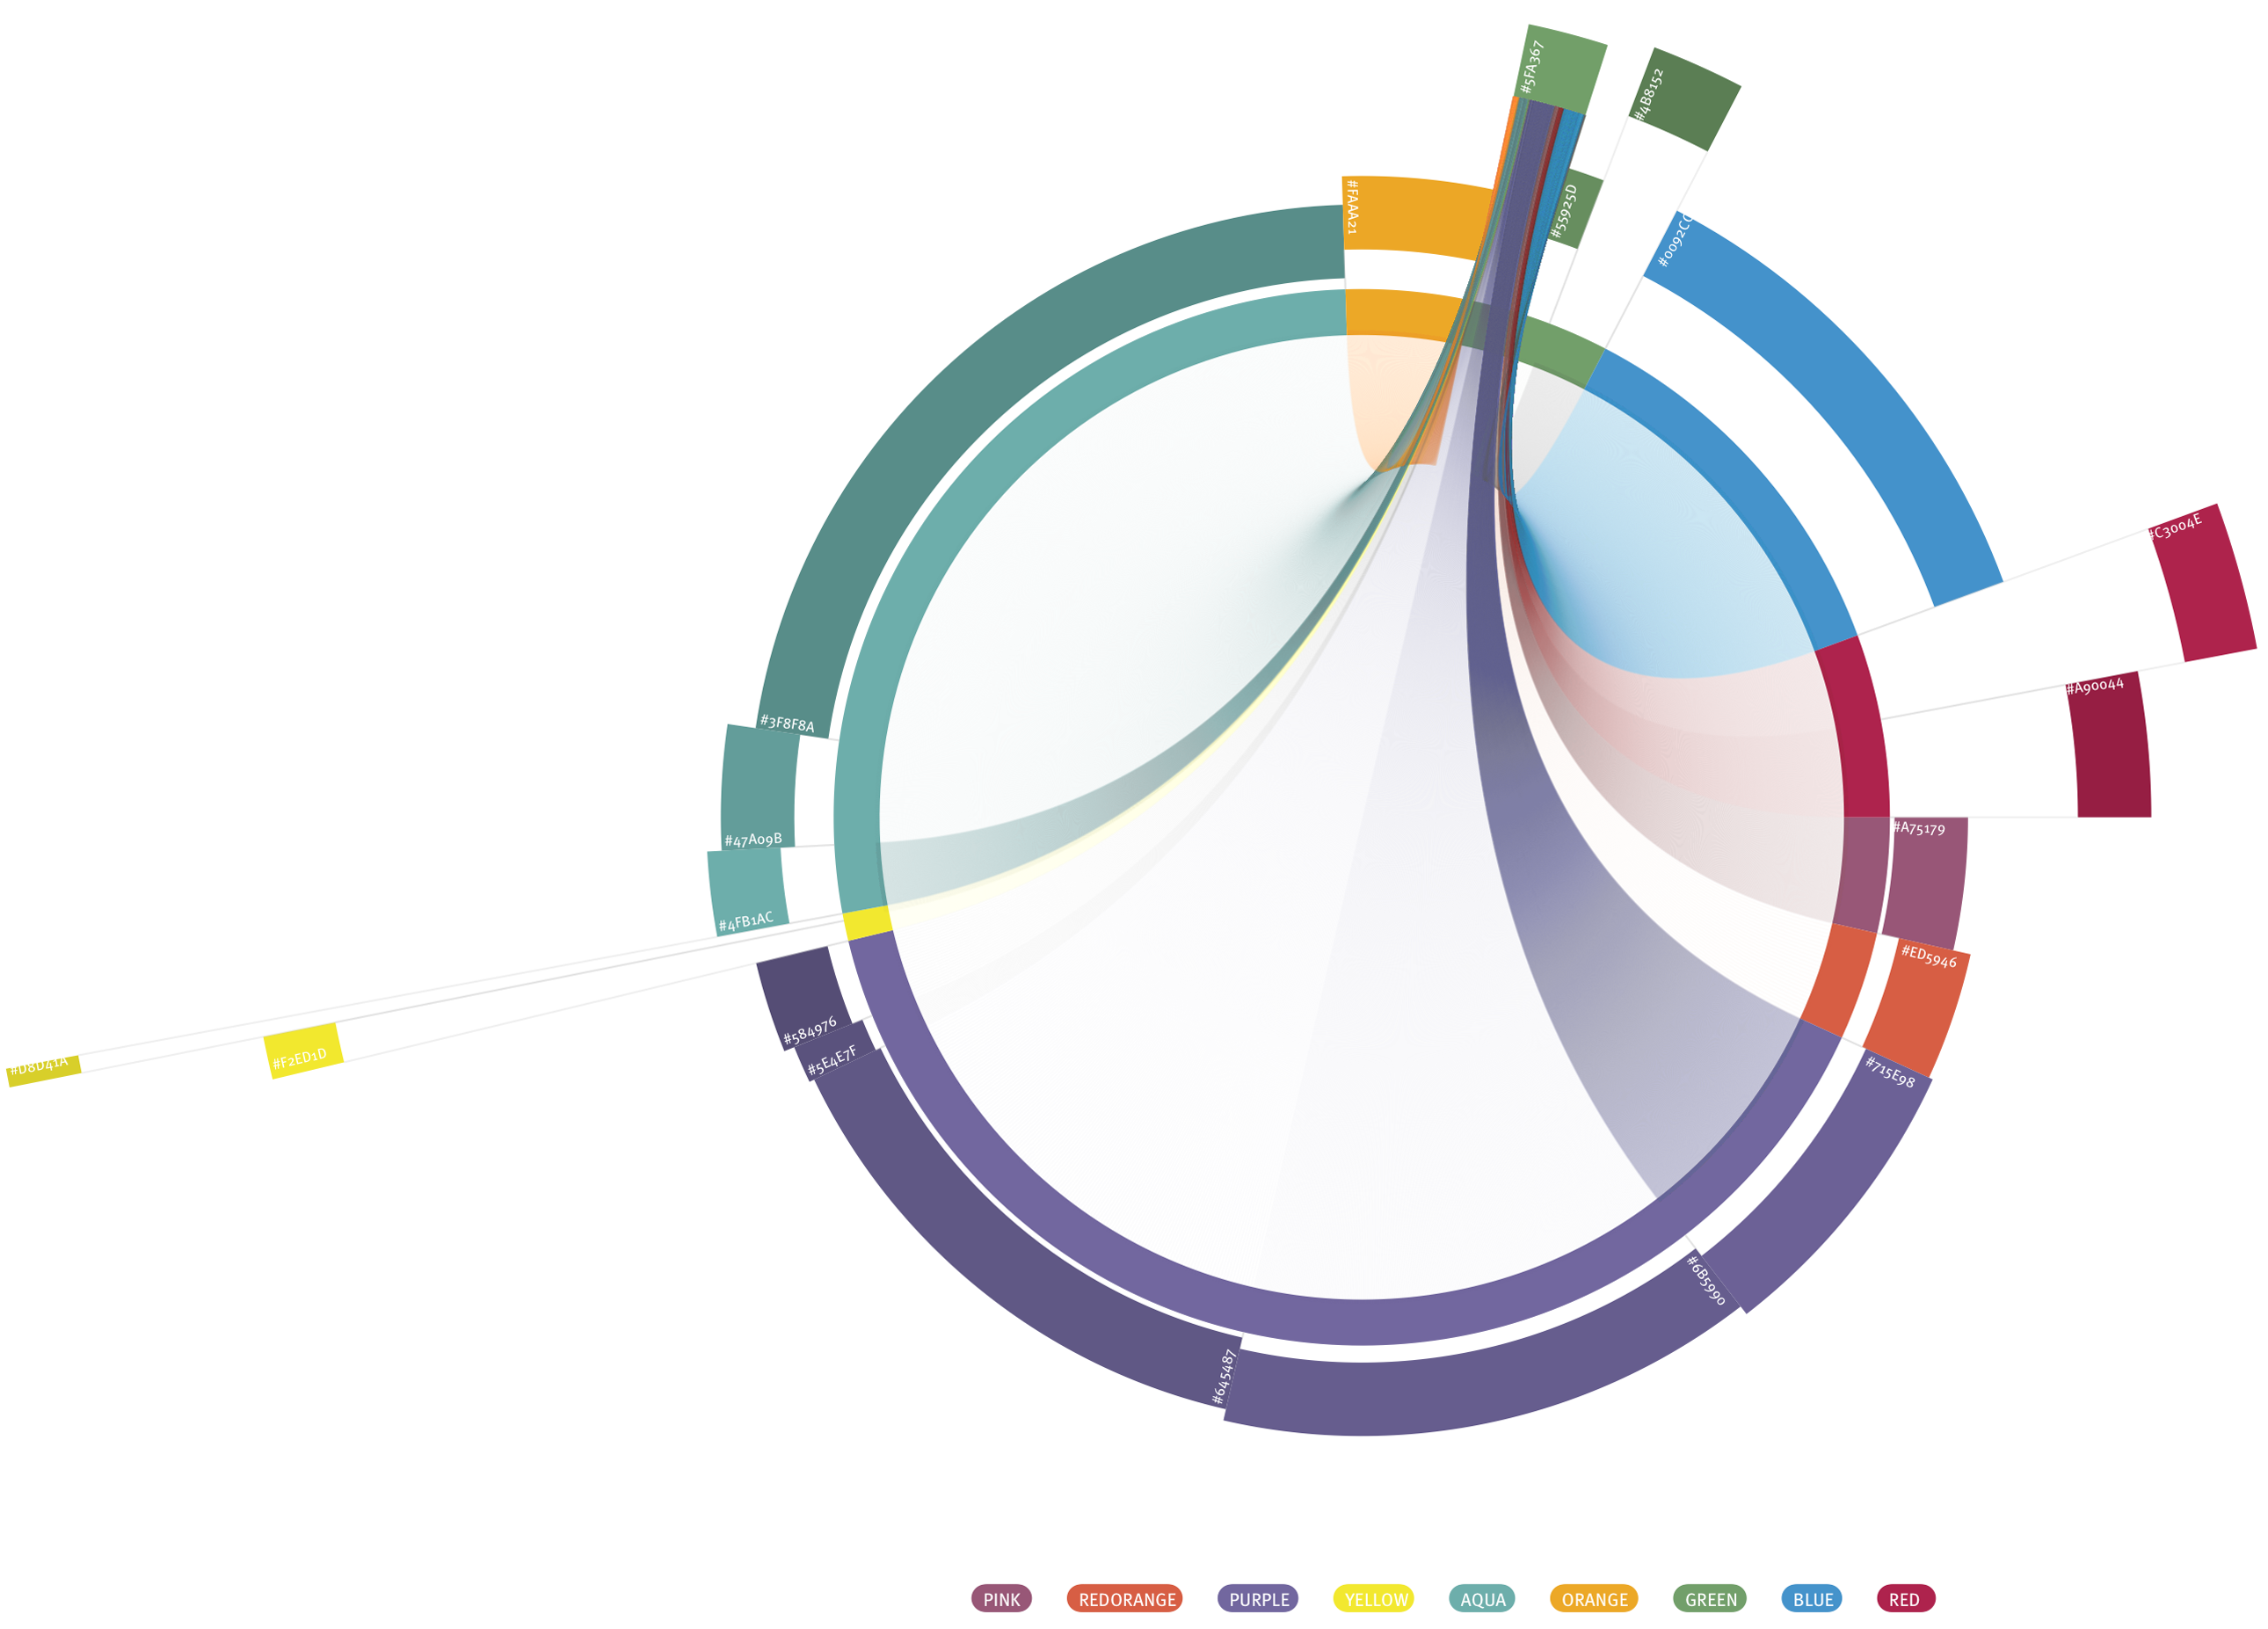
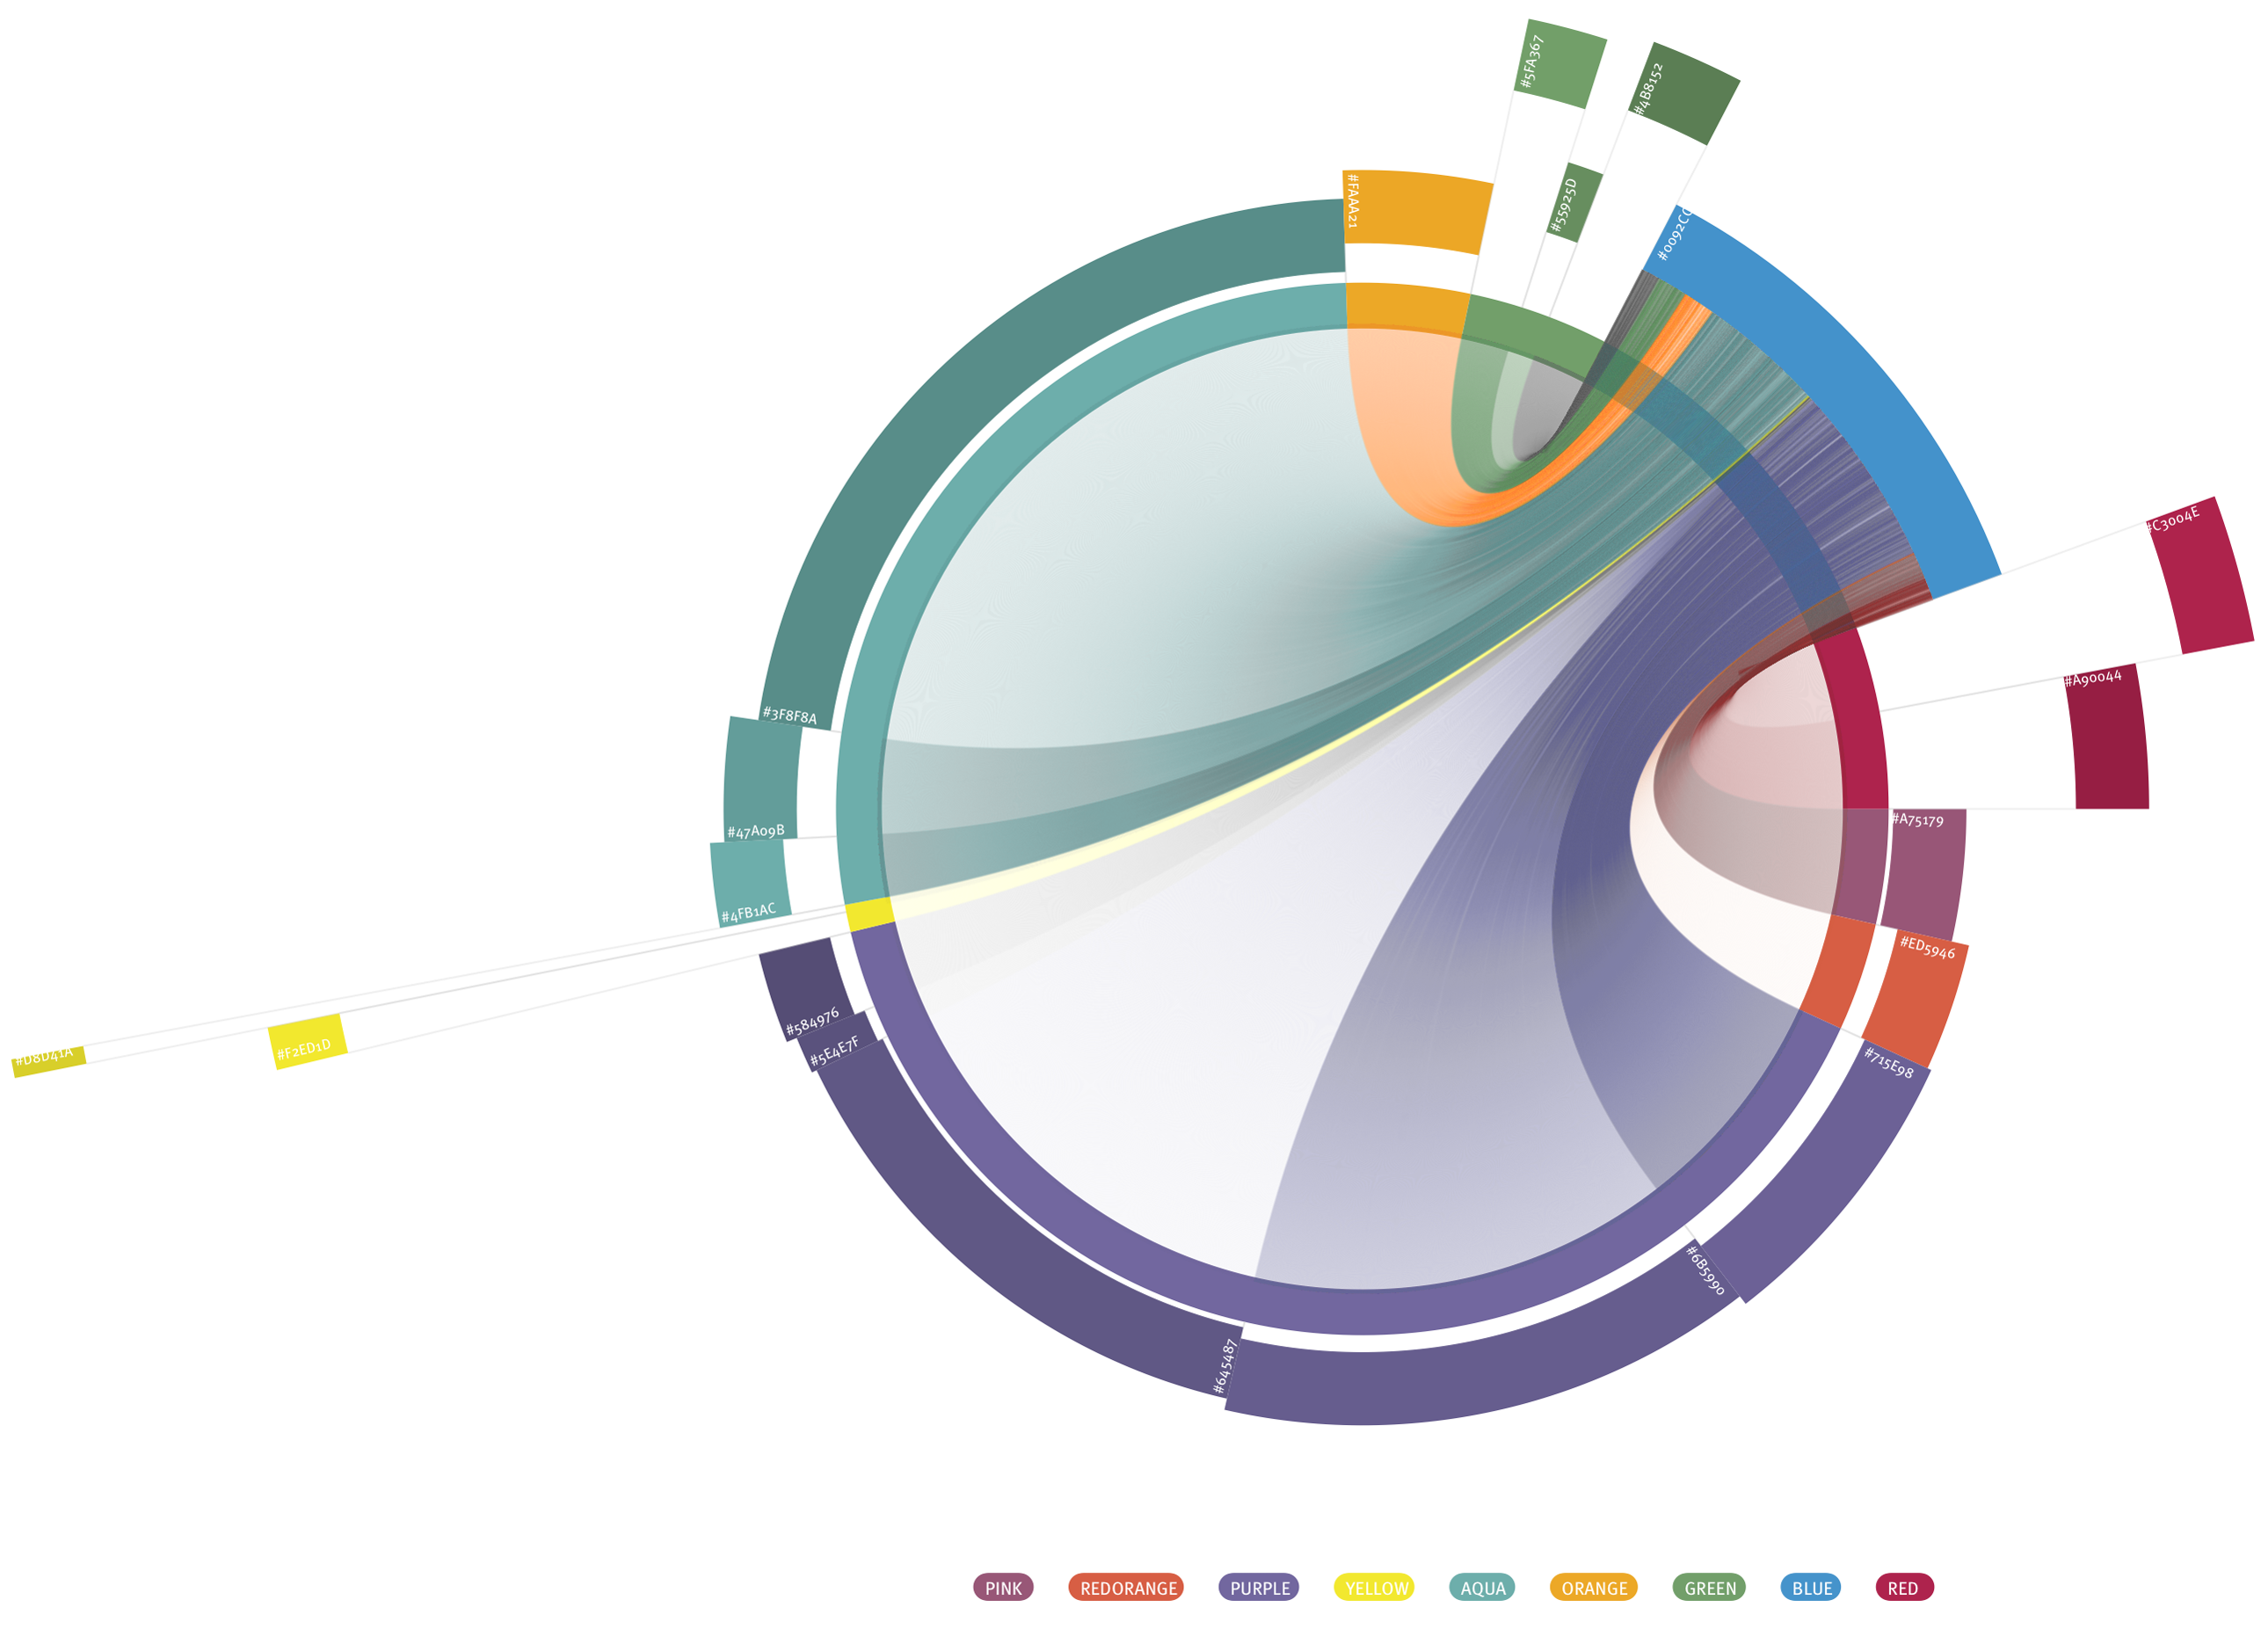
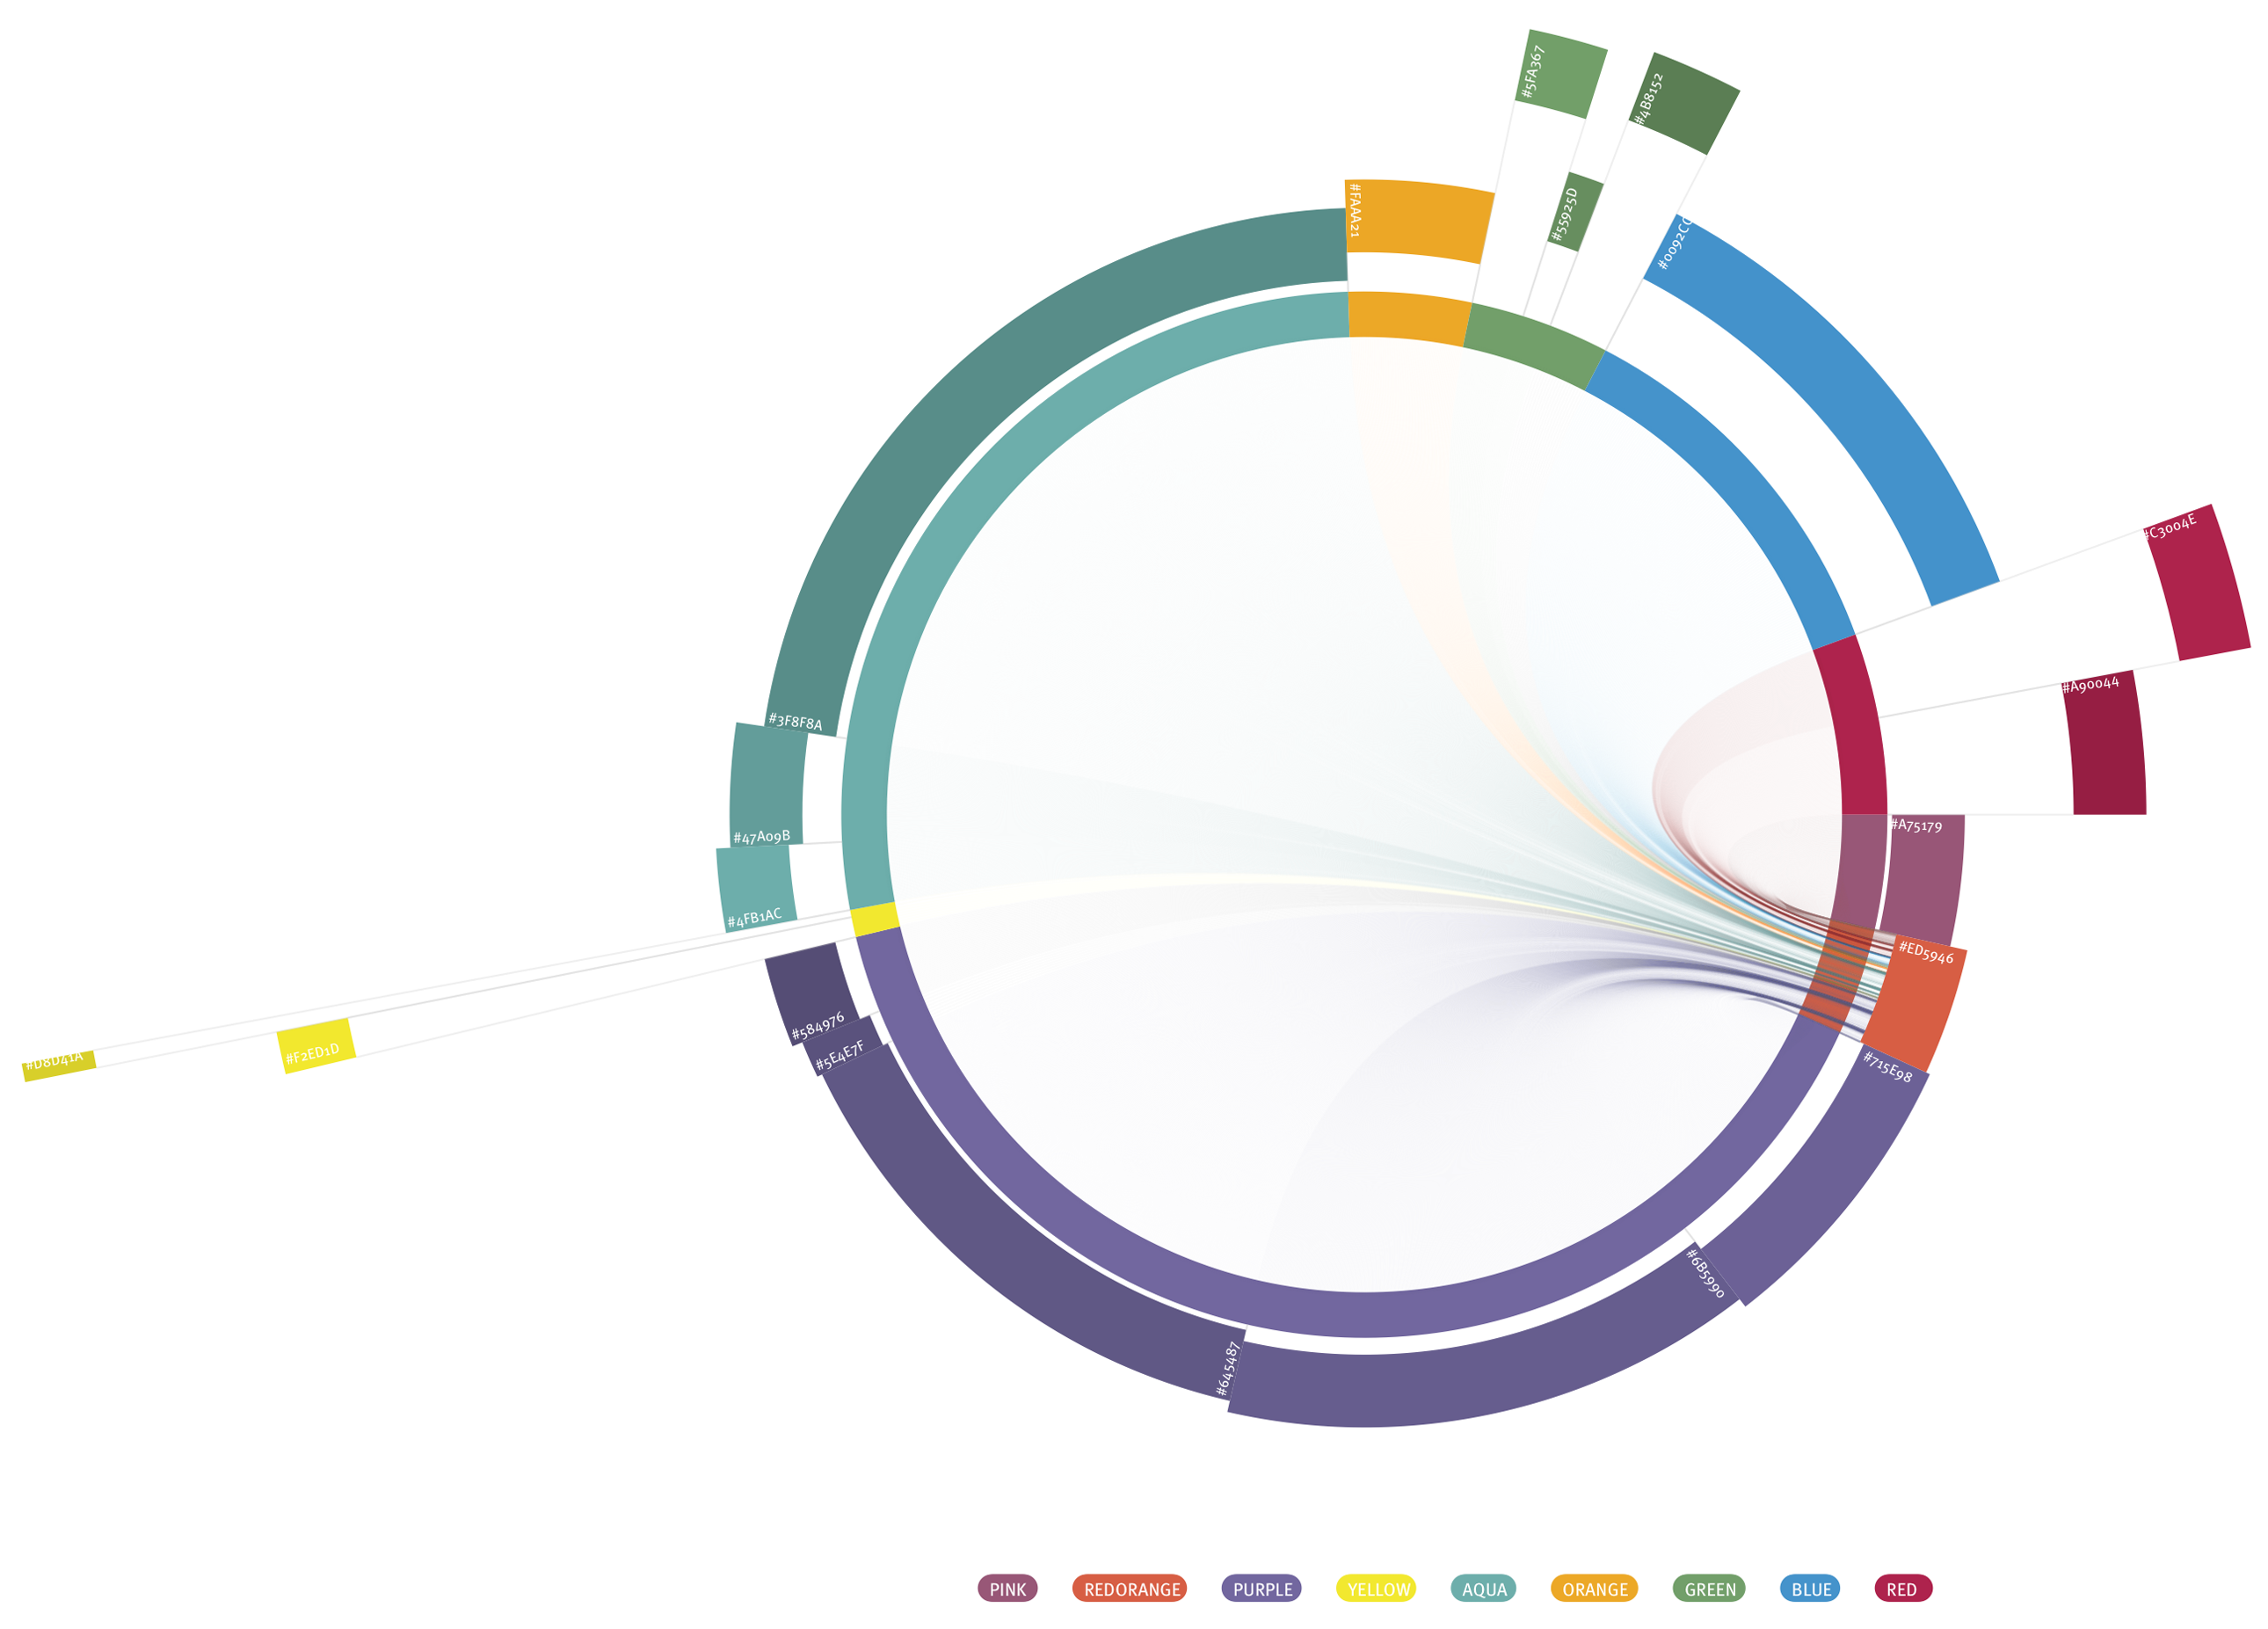
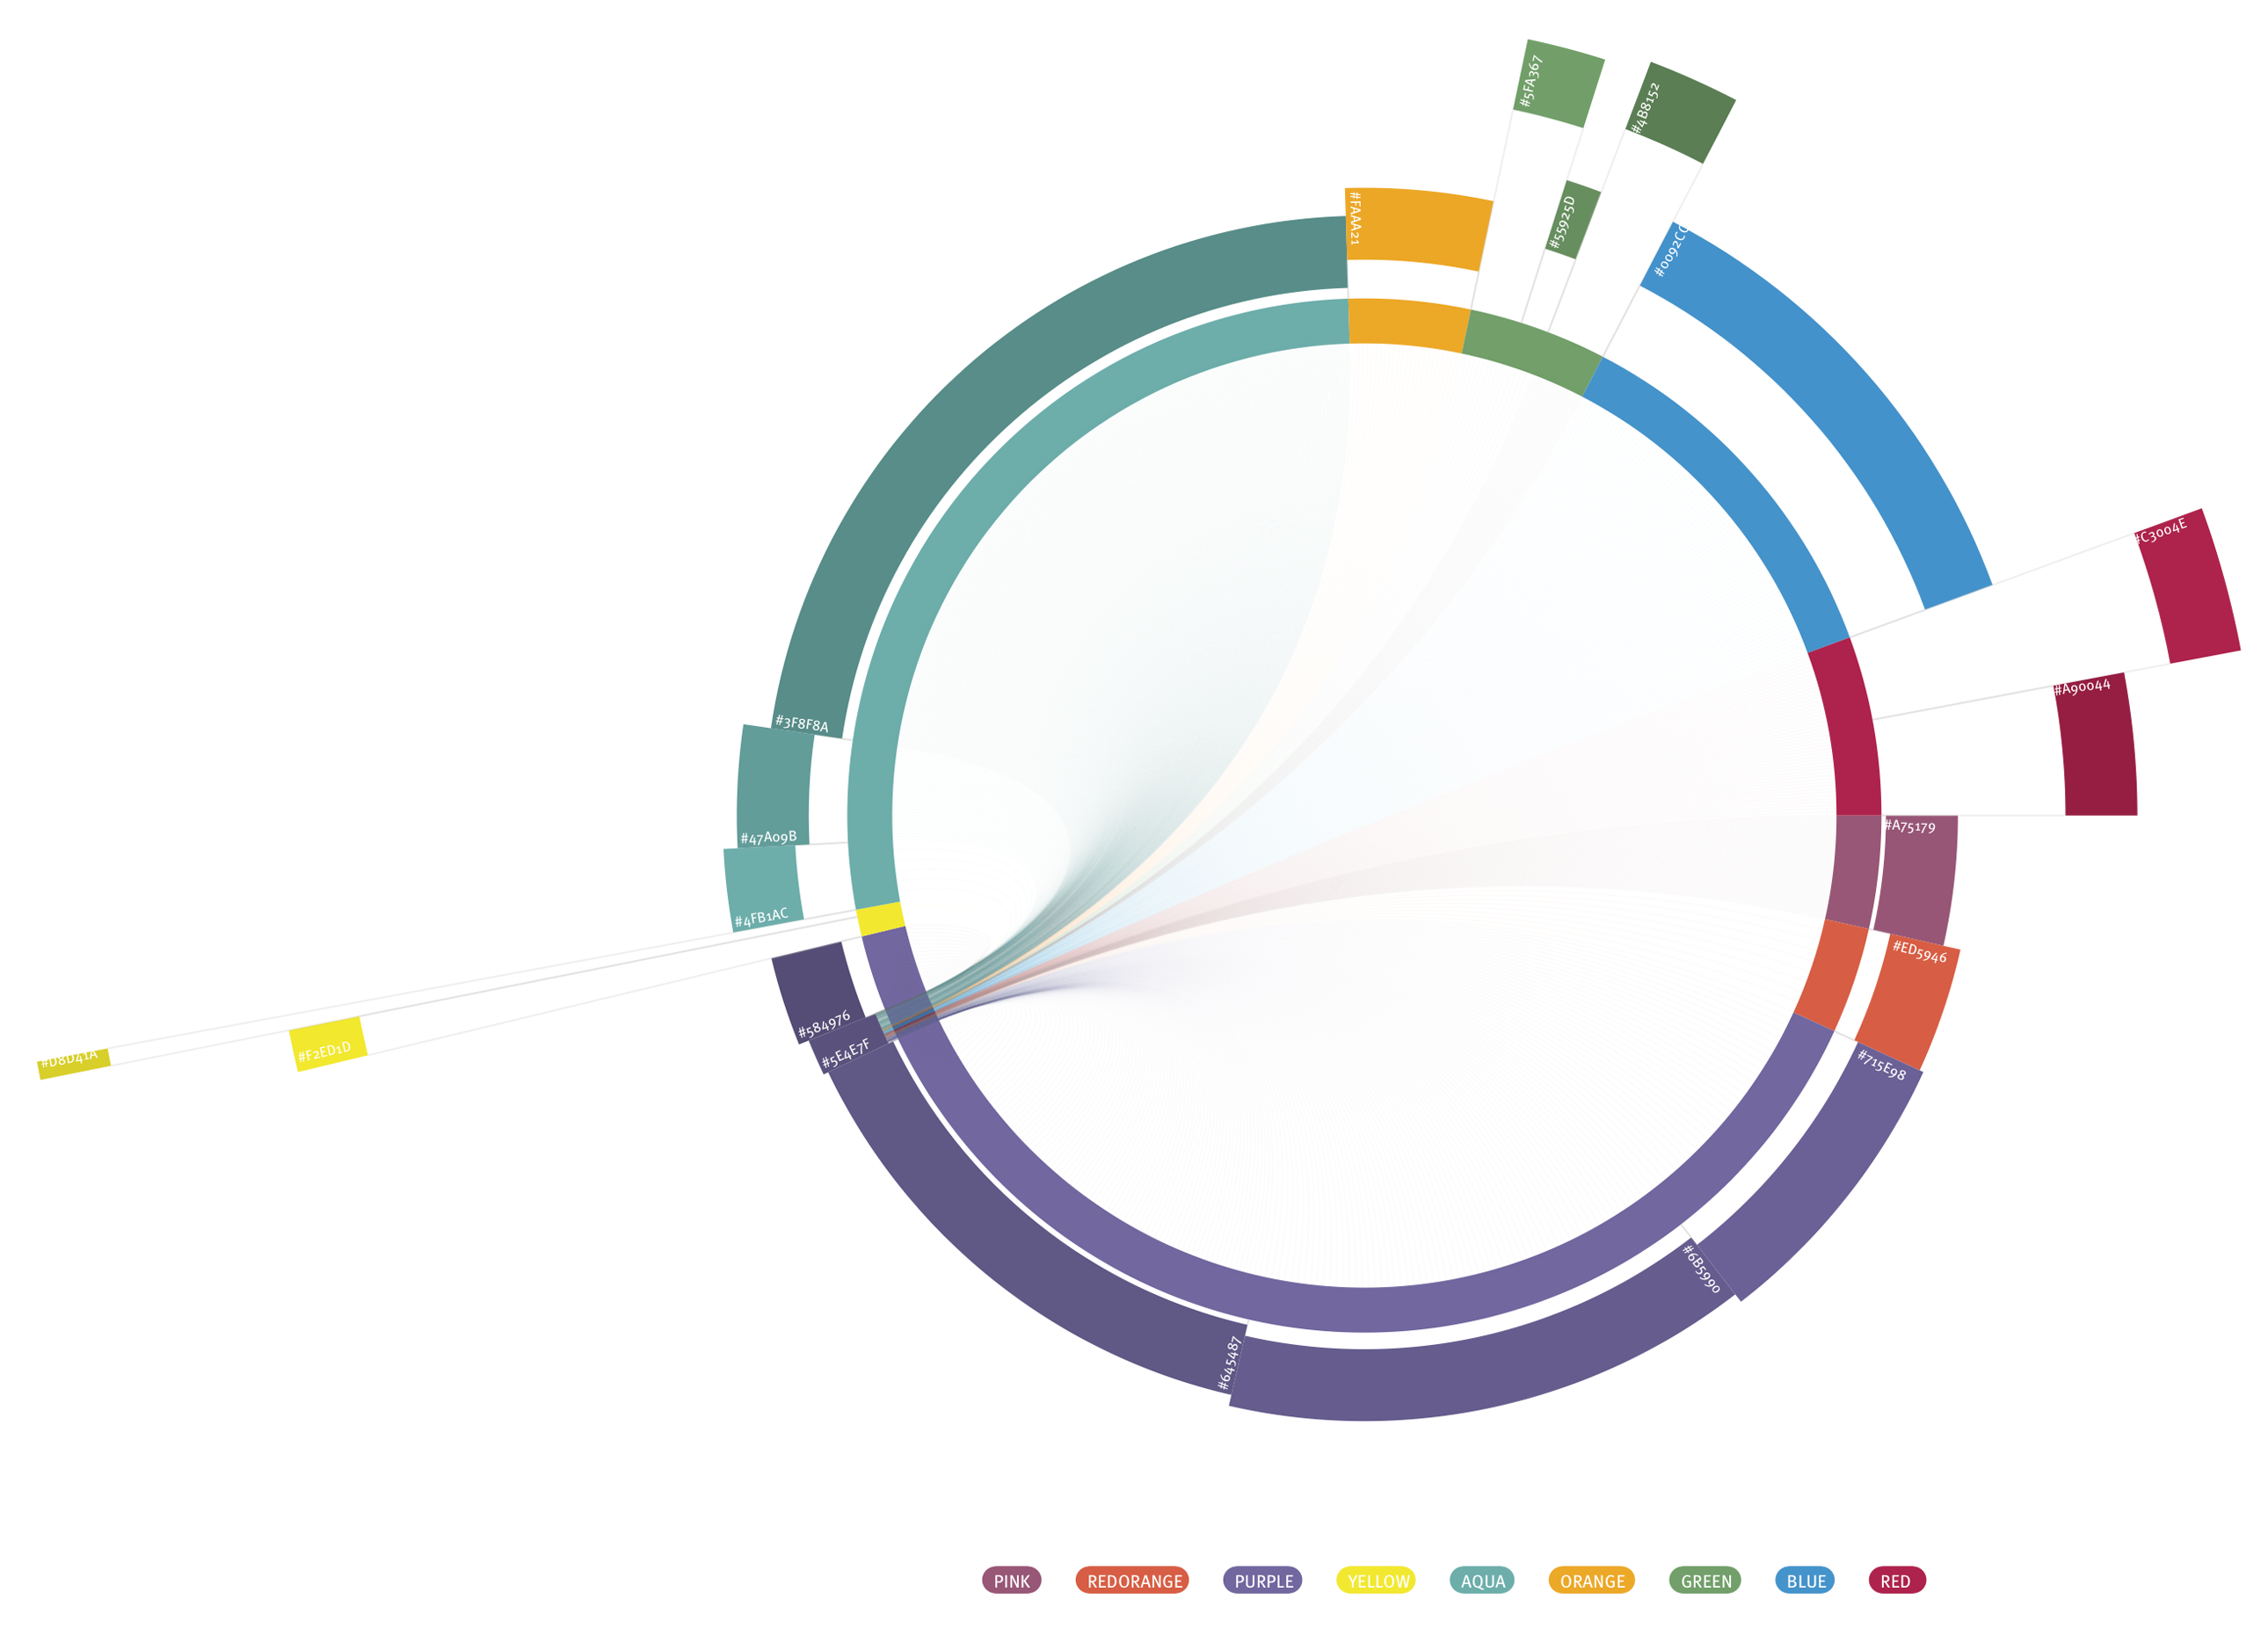
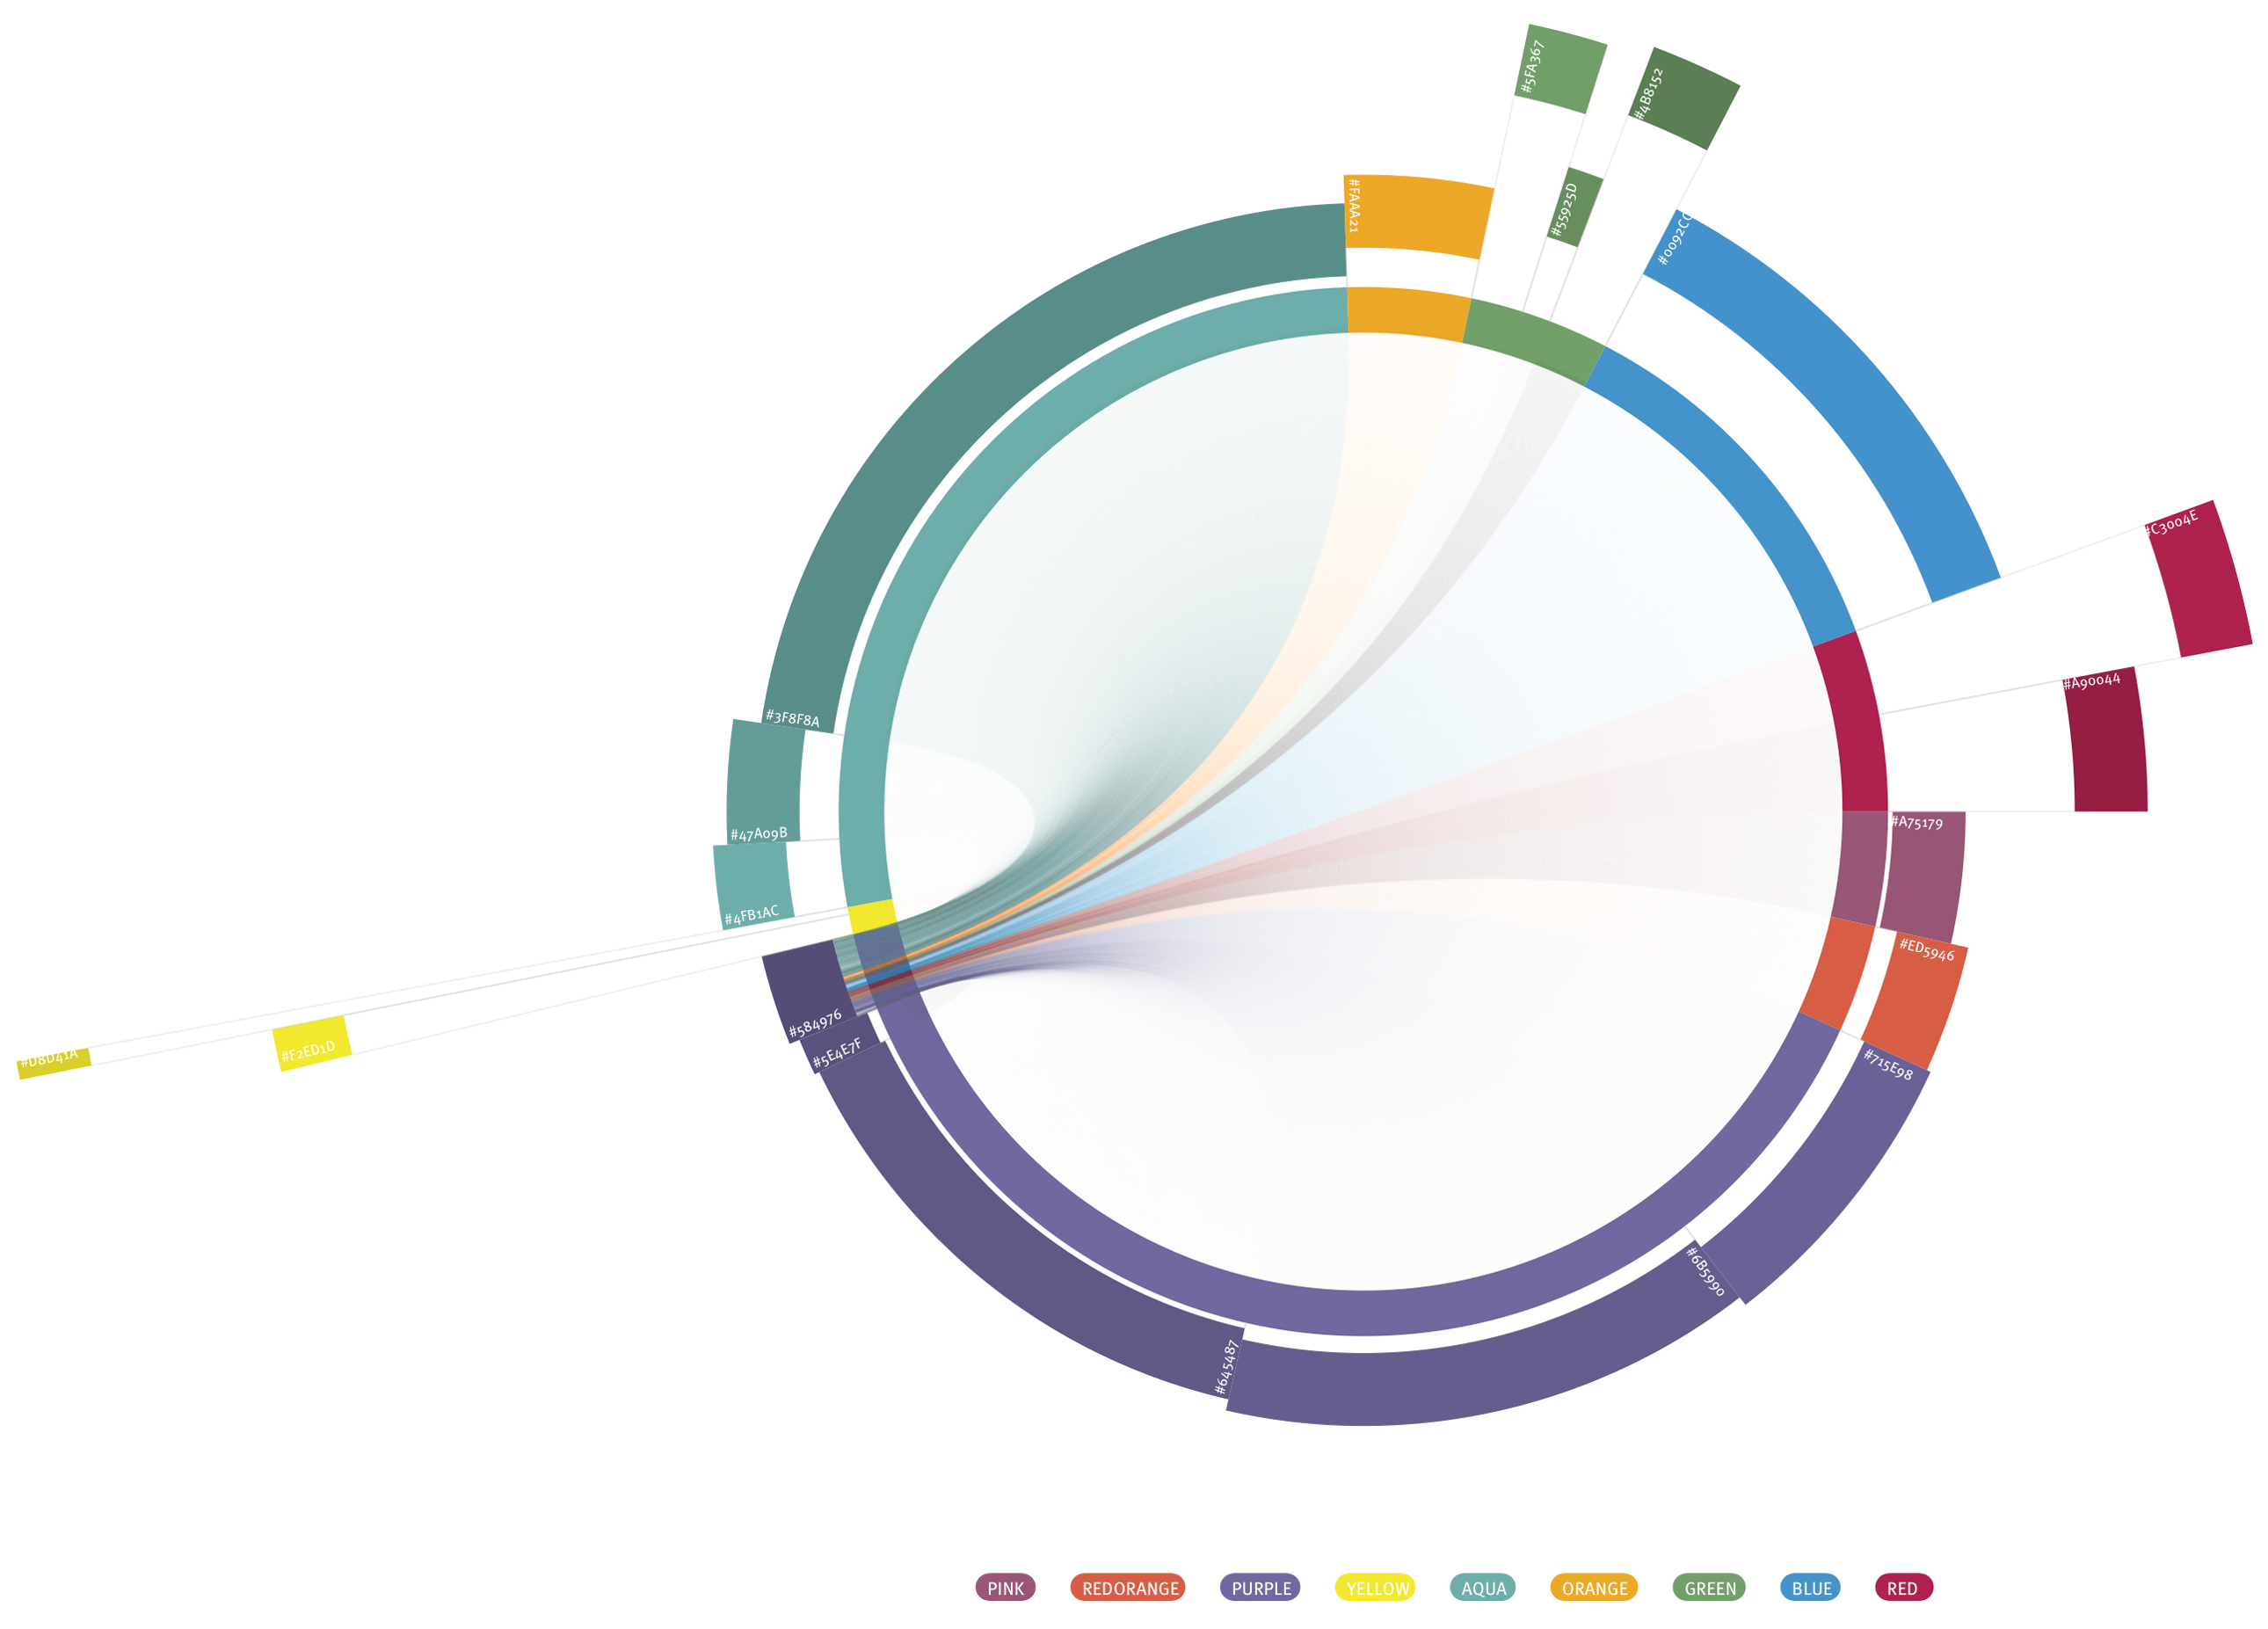
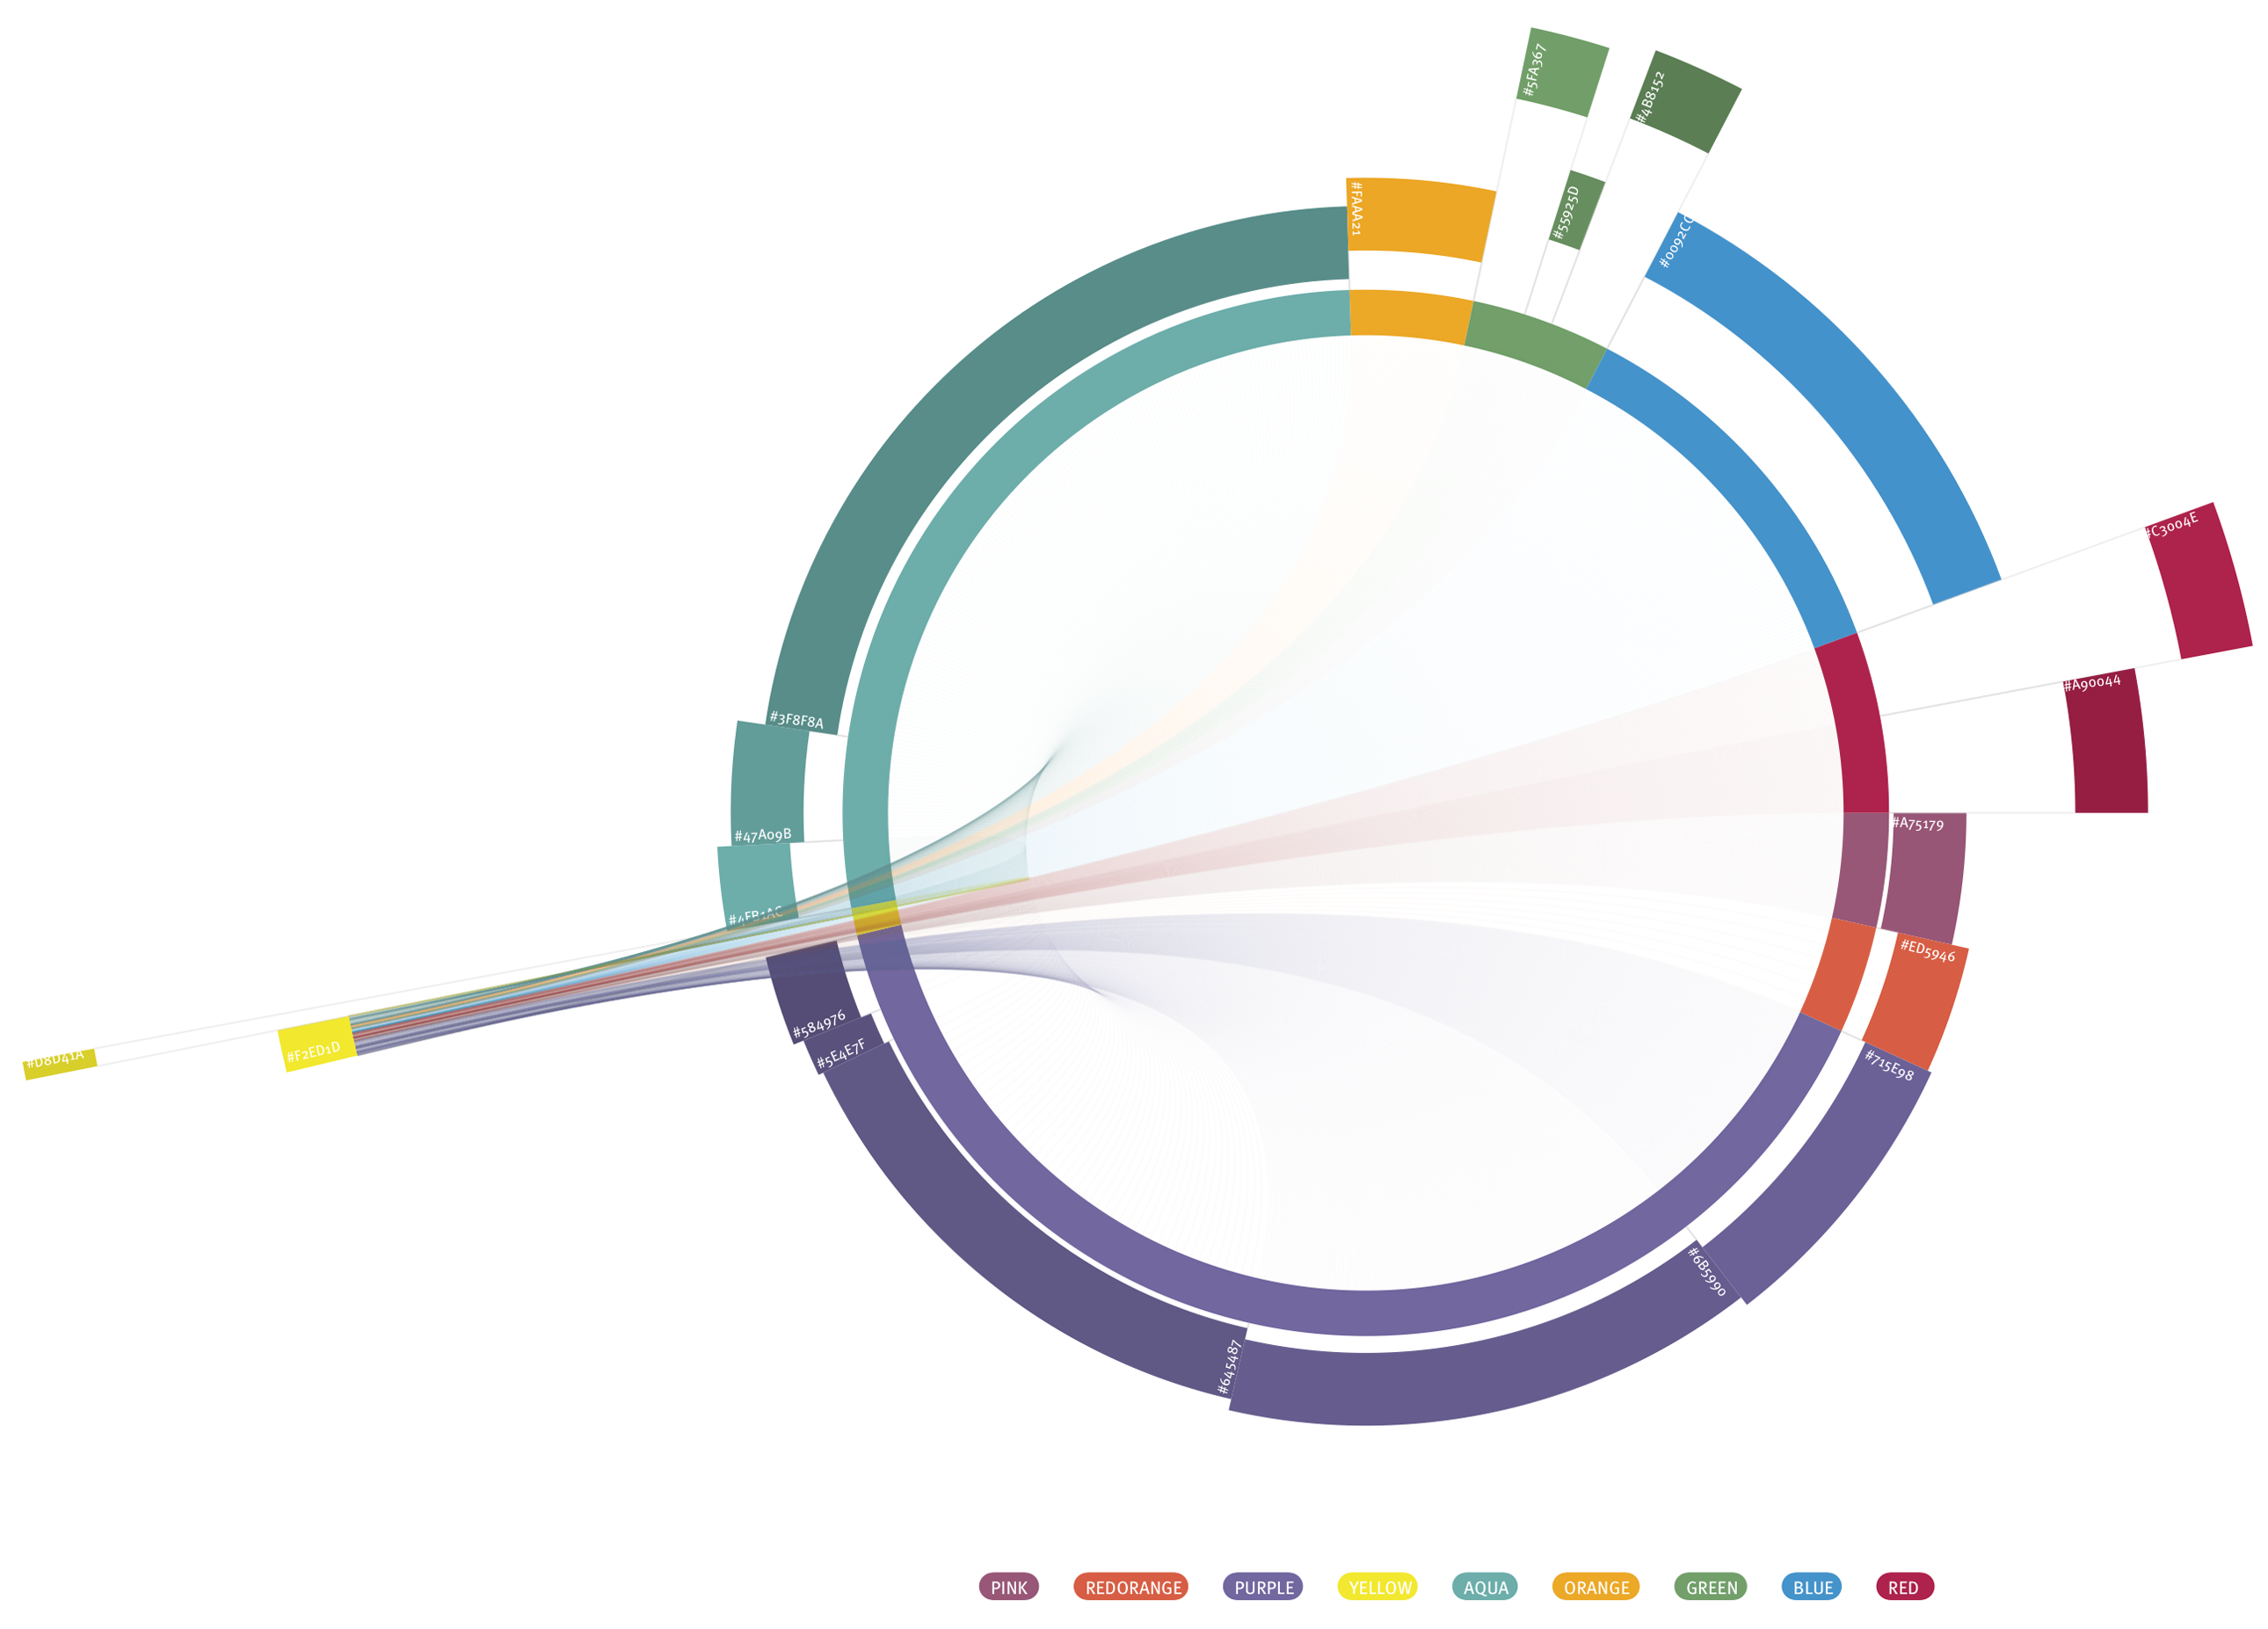
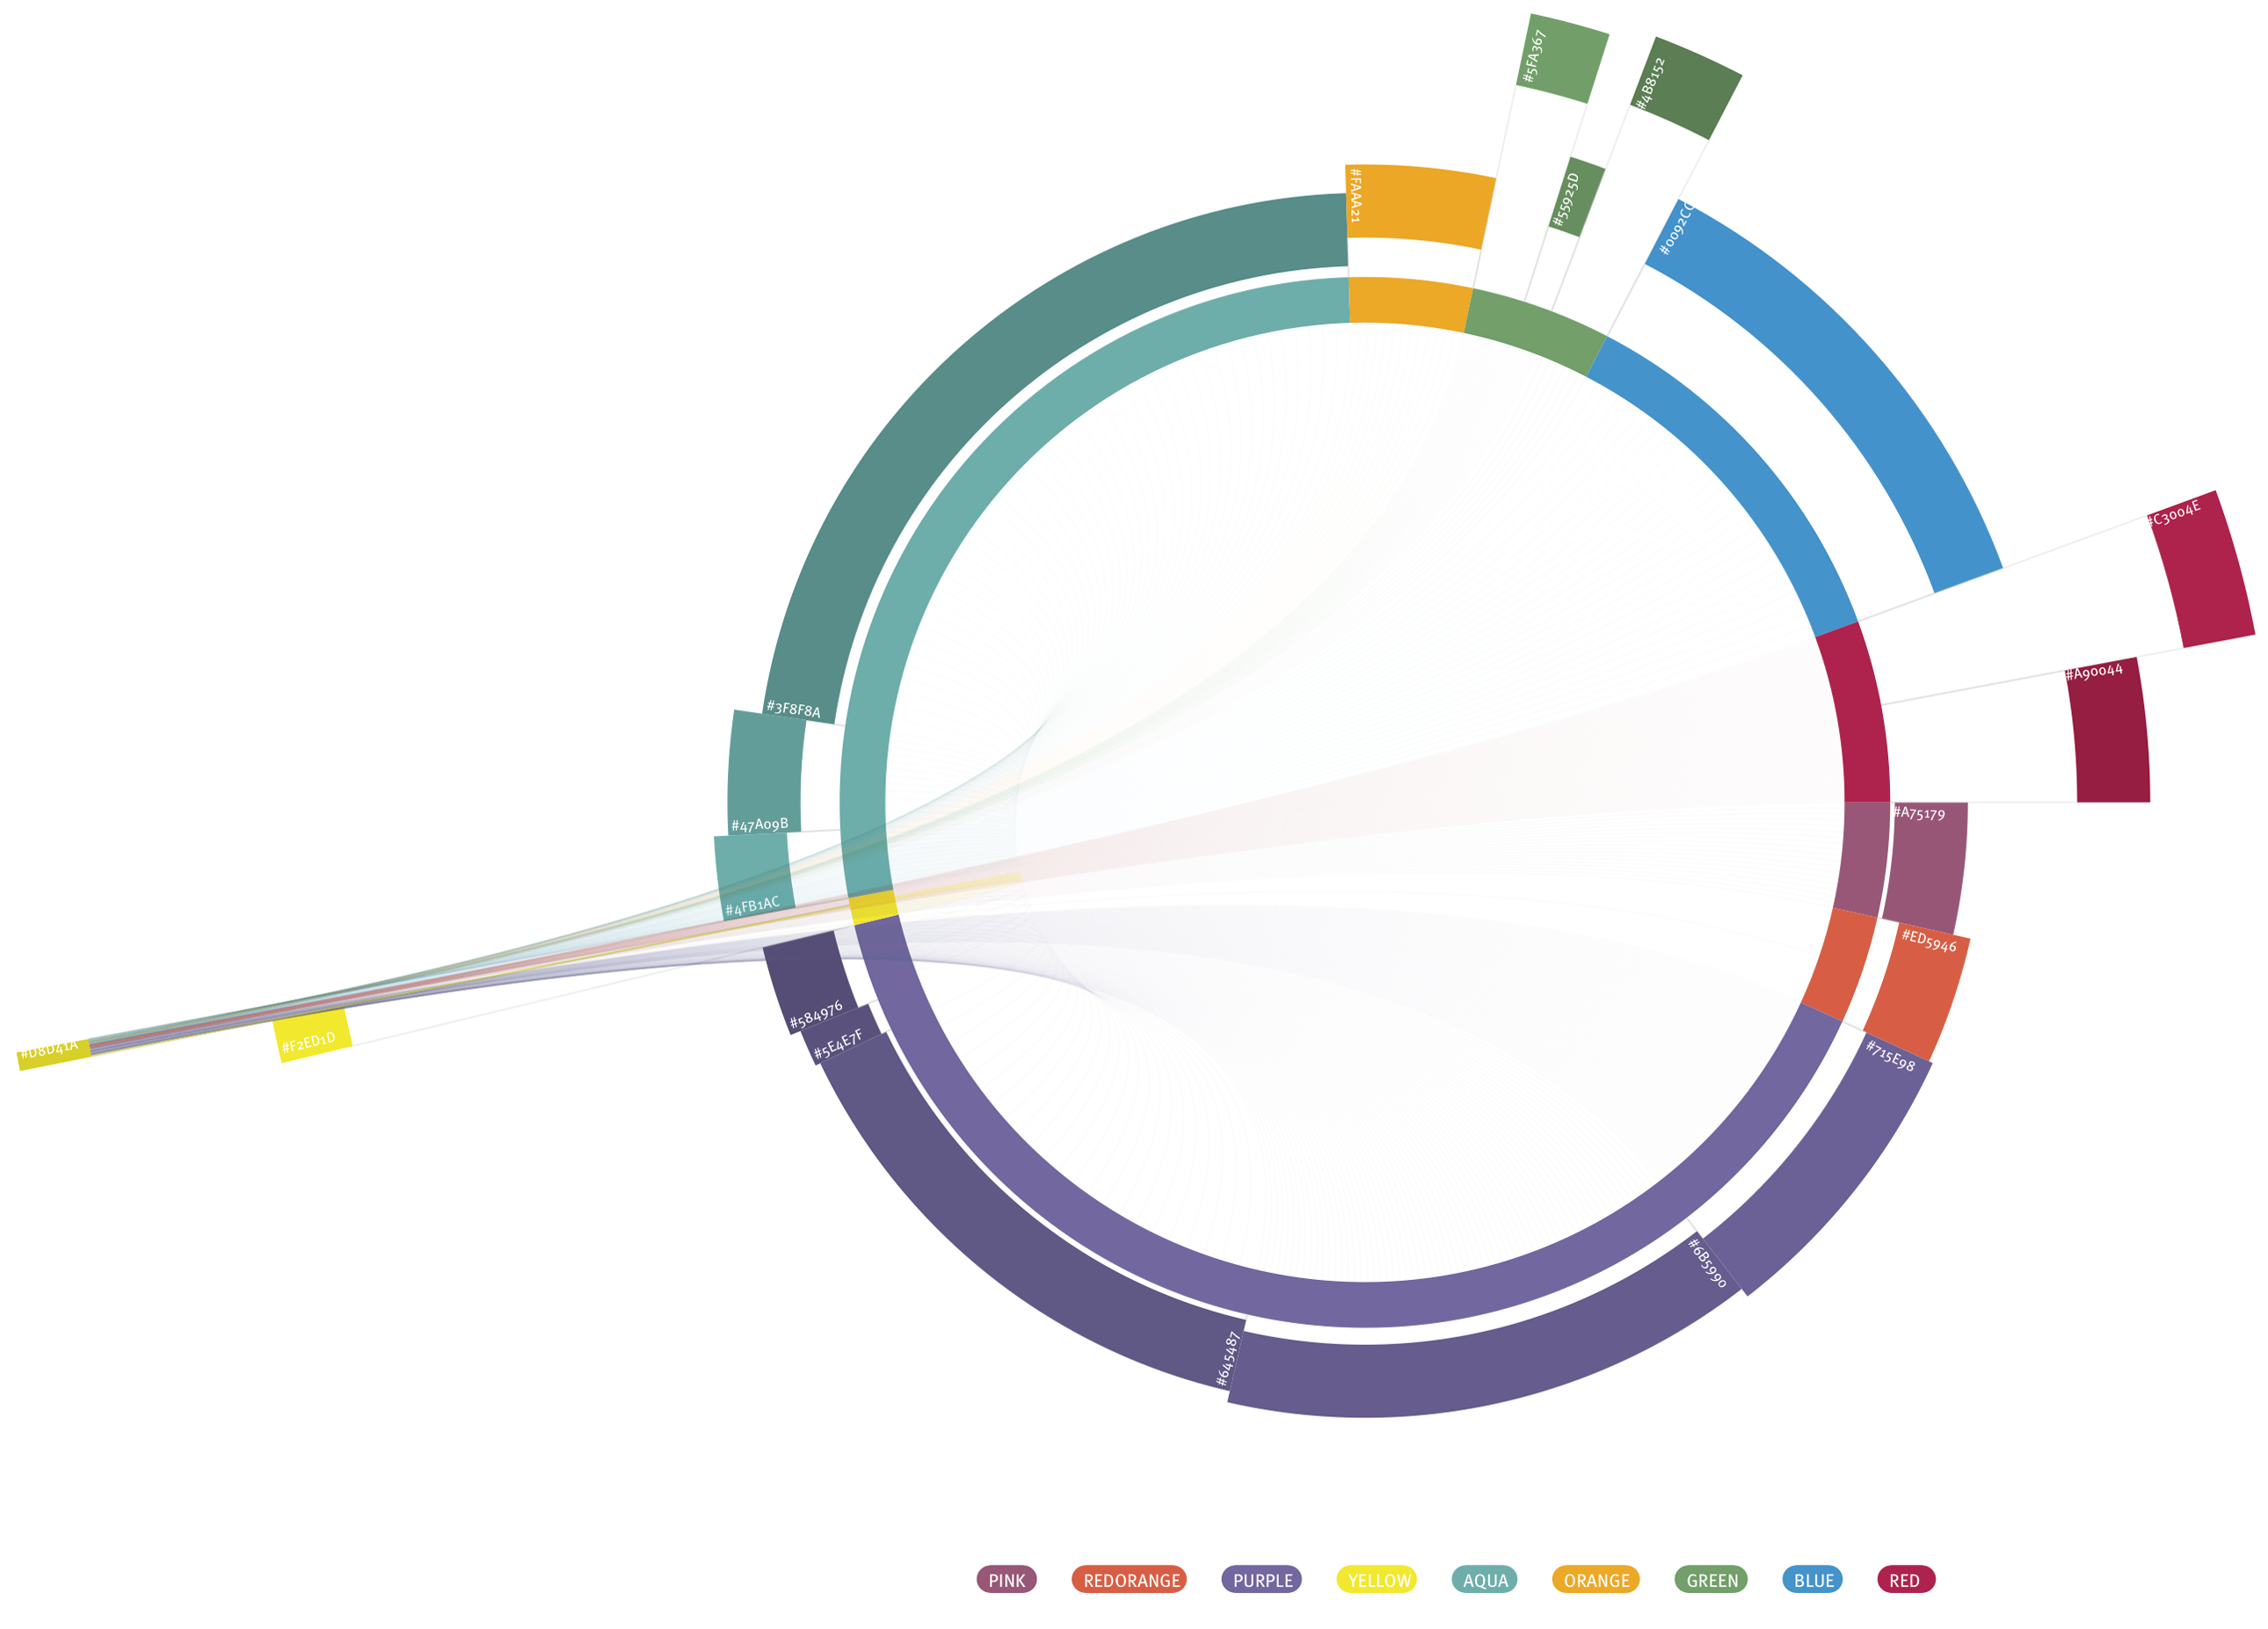
Taking actual human driven data, we mapped out a scenario where each trade between two states created a curved line between the traders. For example, we have the state of #4FB1AC in the nation of Aqua in our first iteration below. From observation, one can see that approximately 30% of their trade is with the nation of Purple (mostly with Purple's #715E98 state). Each thumbnail below can be clicked to further explore that state's trade.
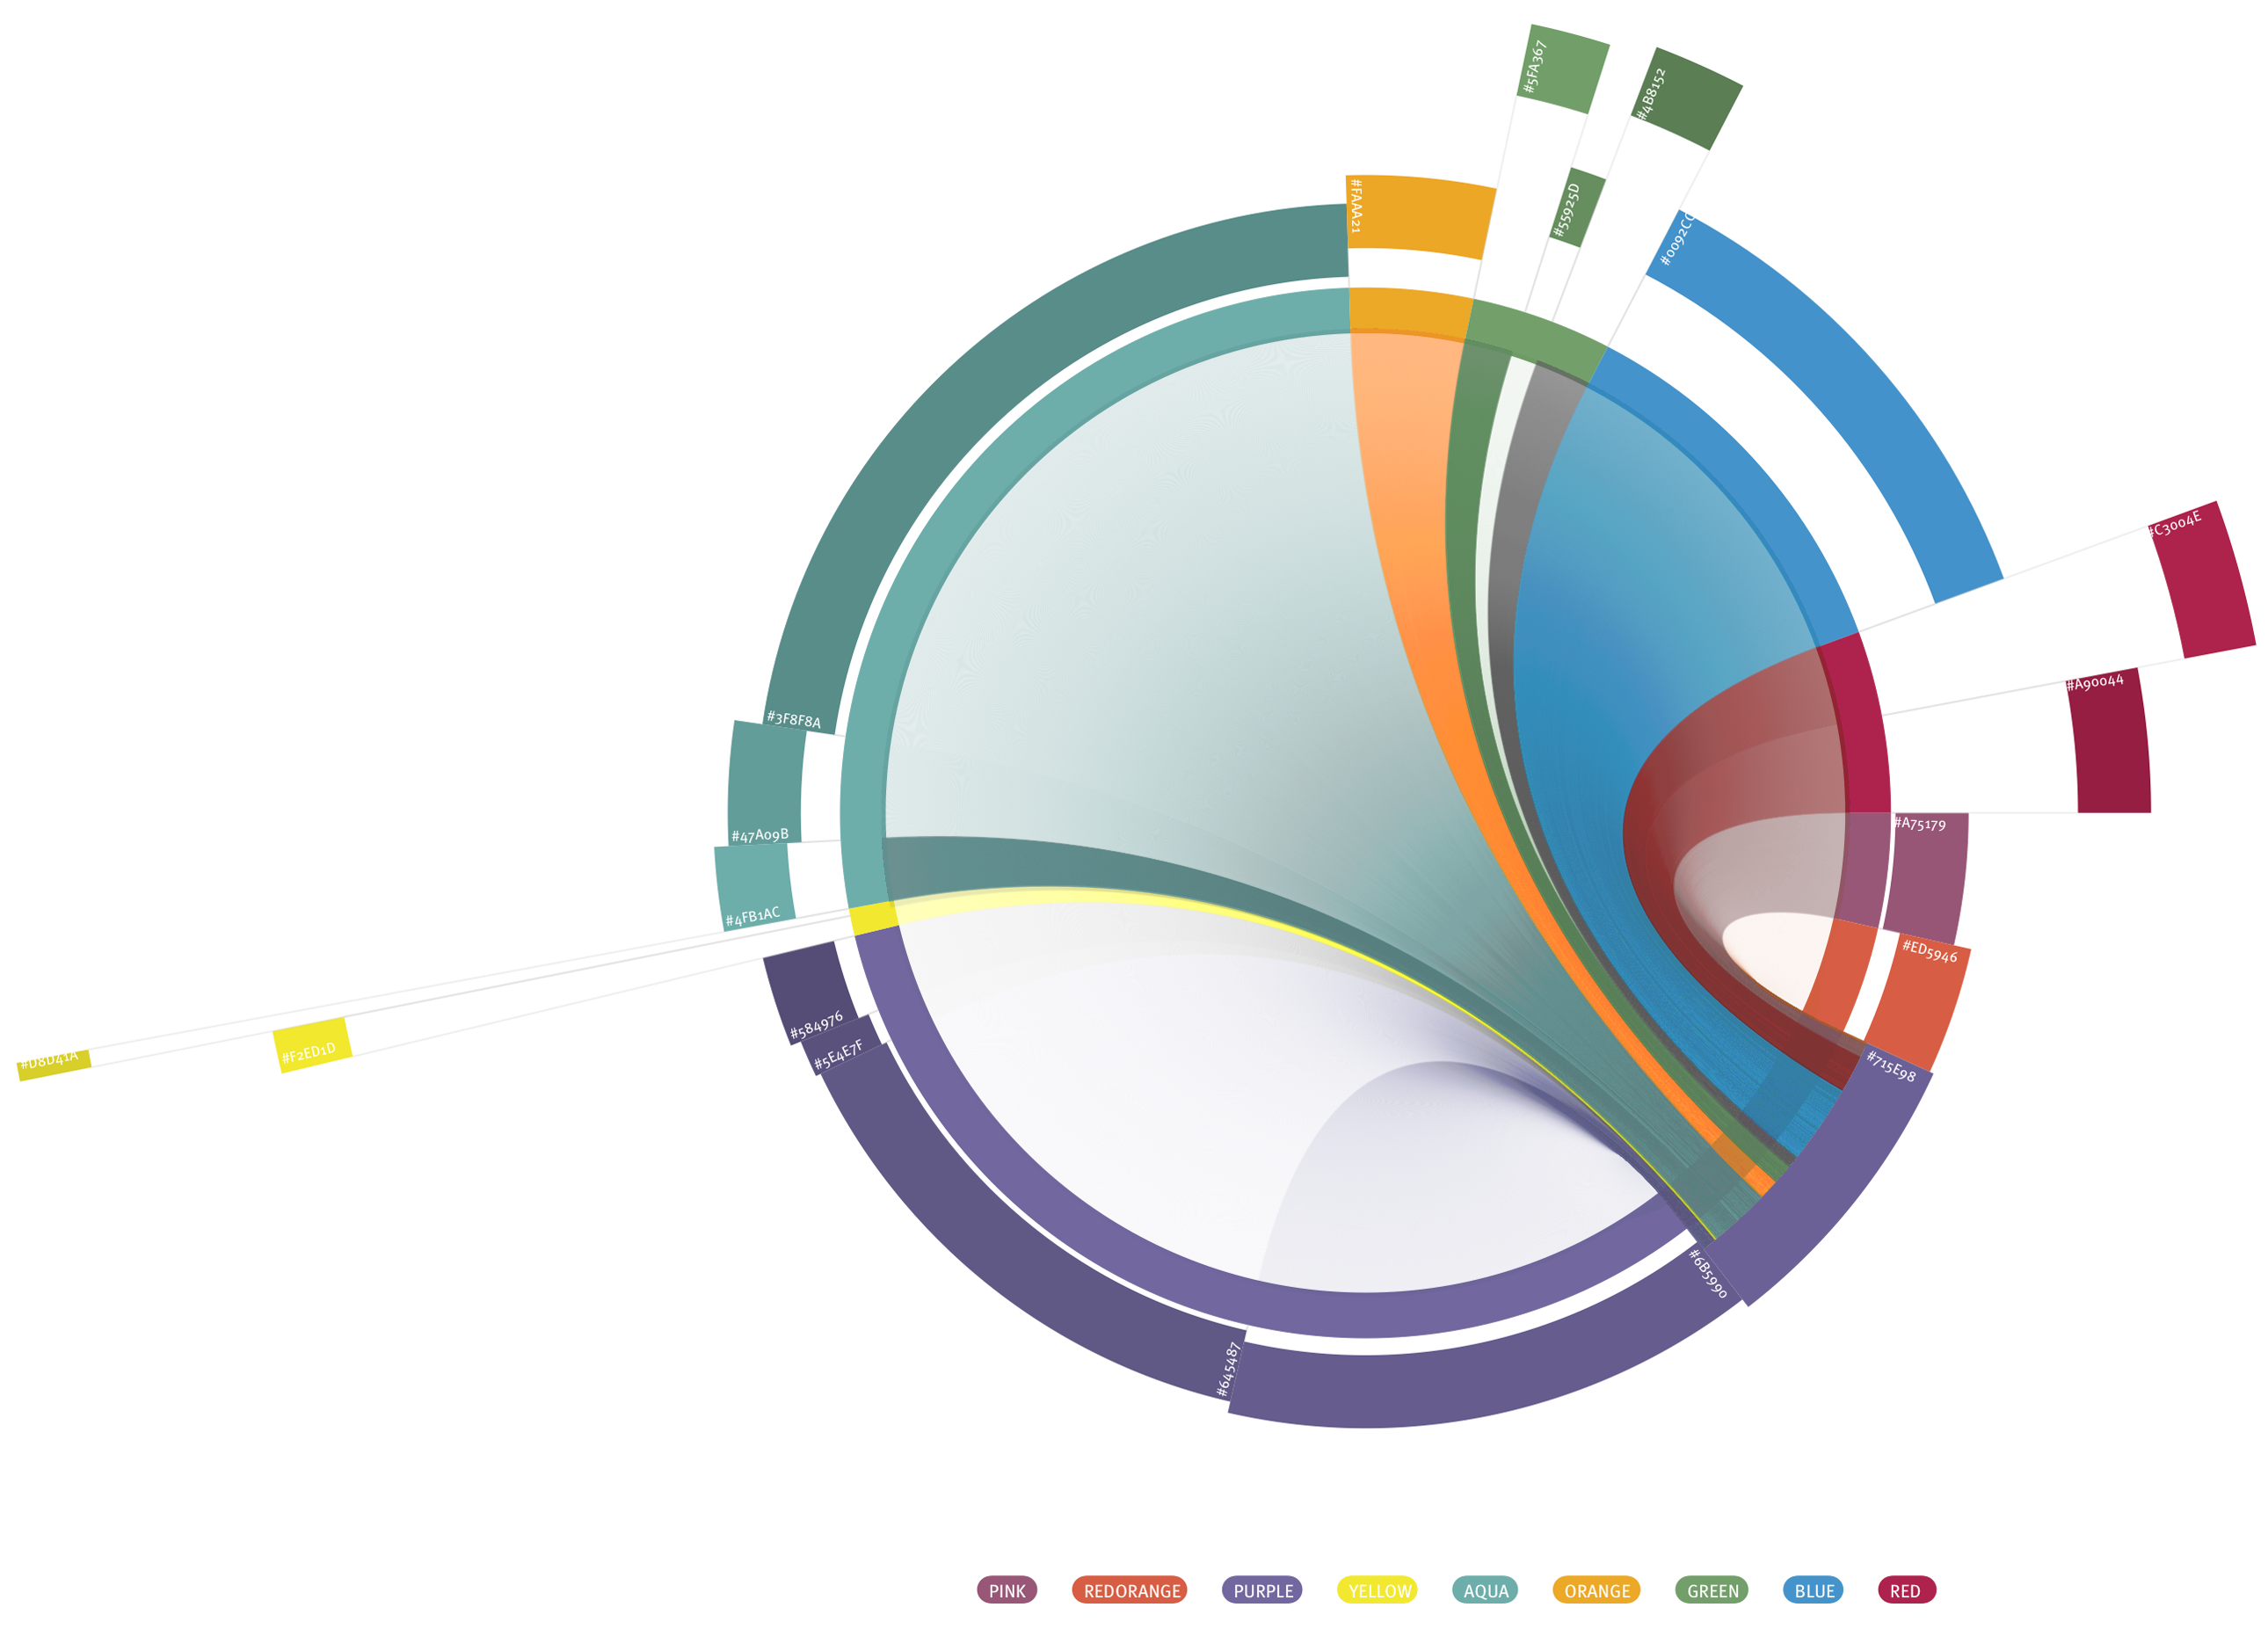
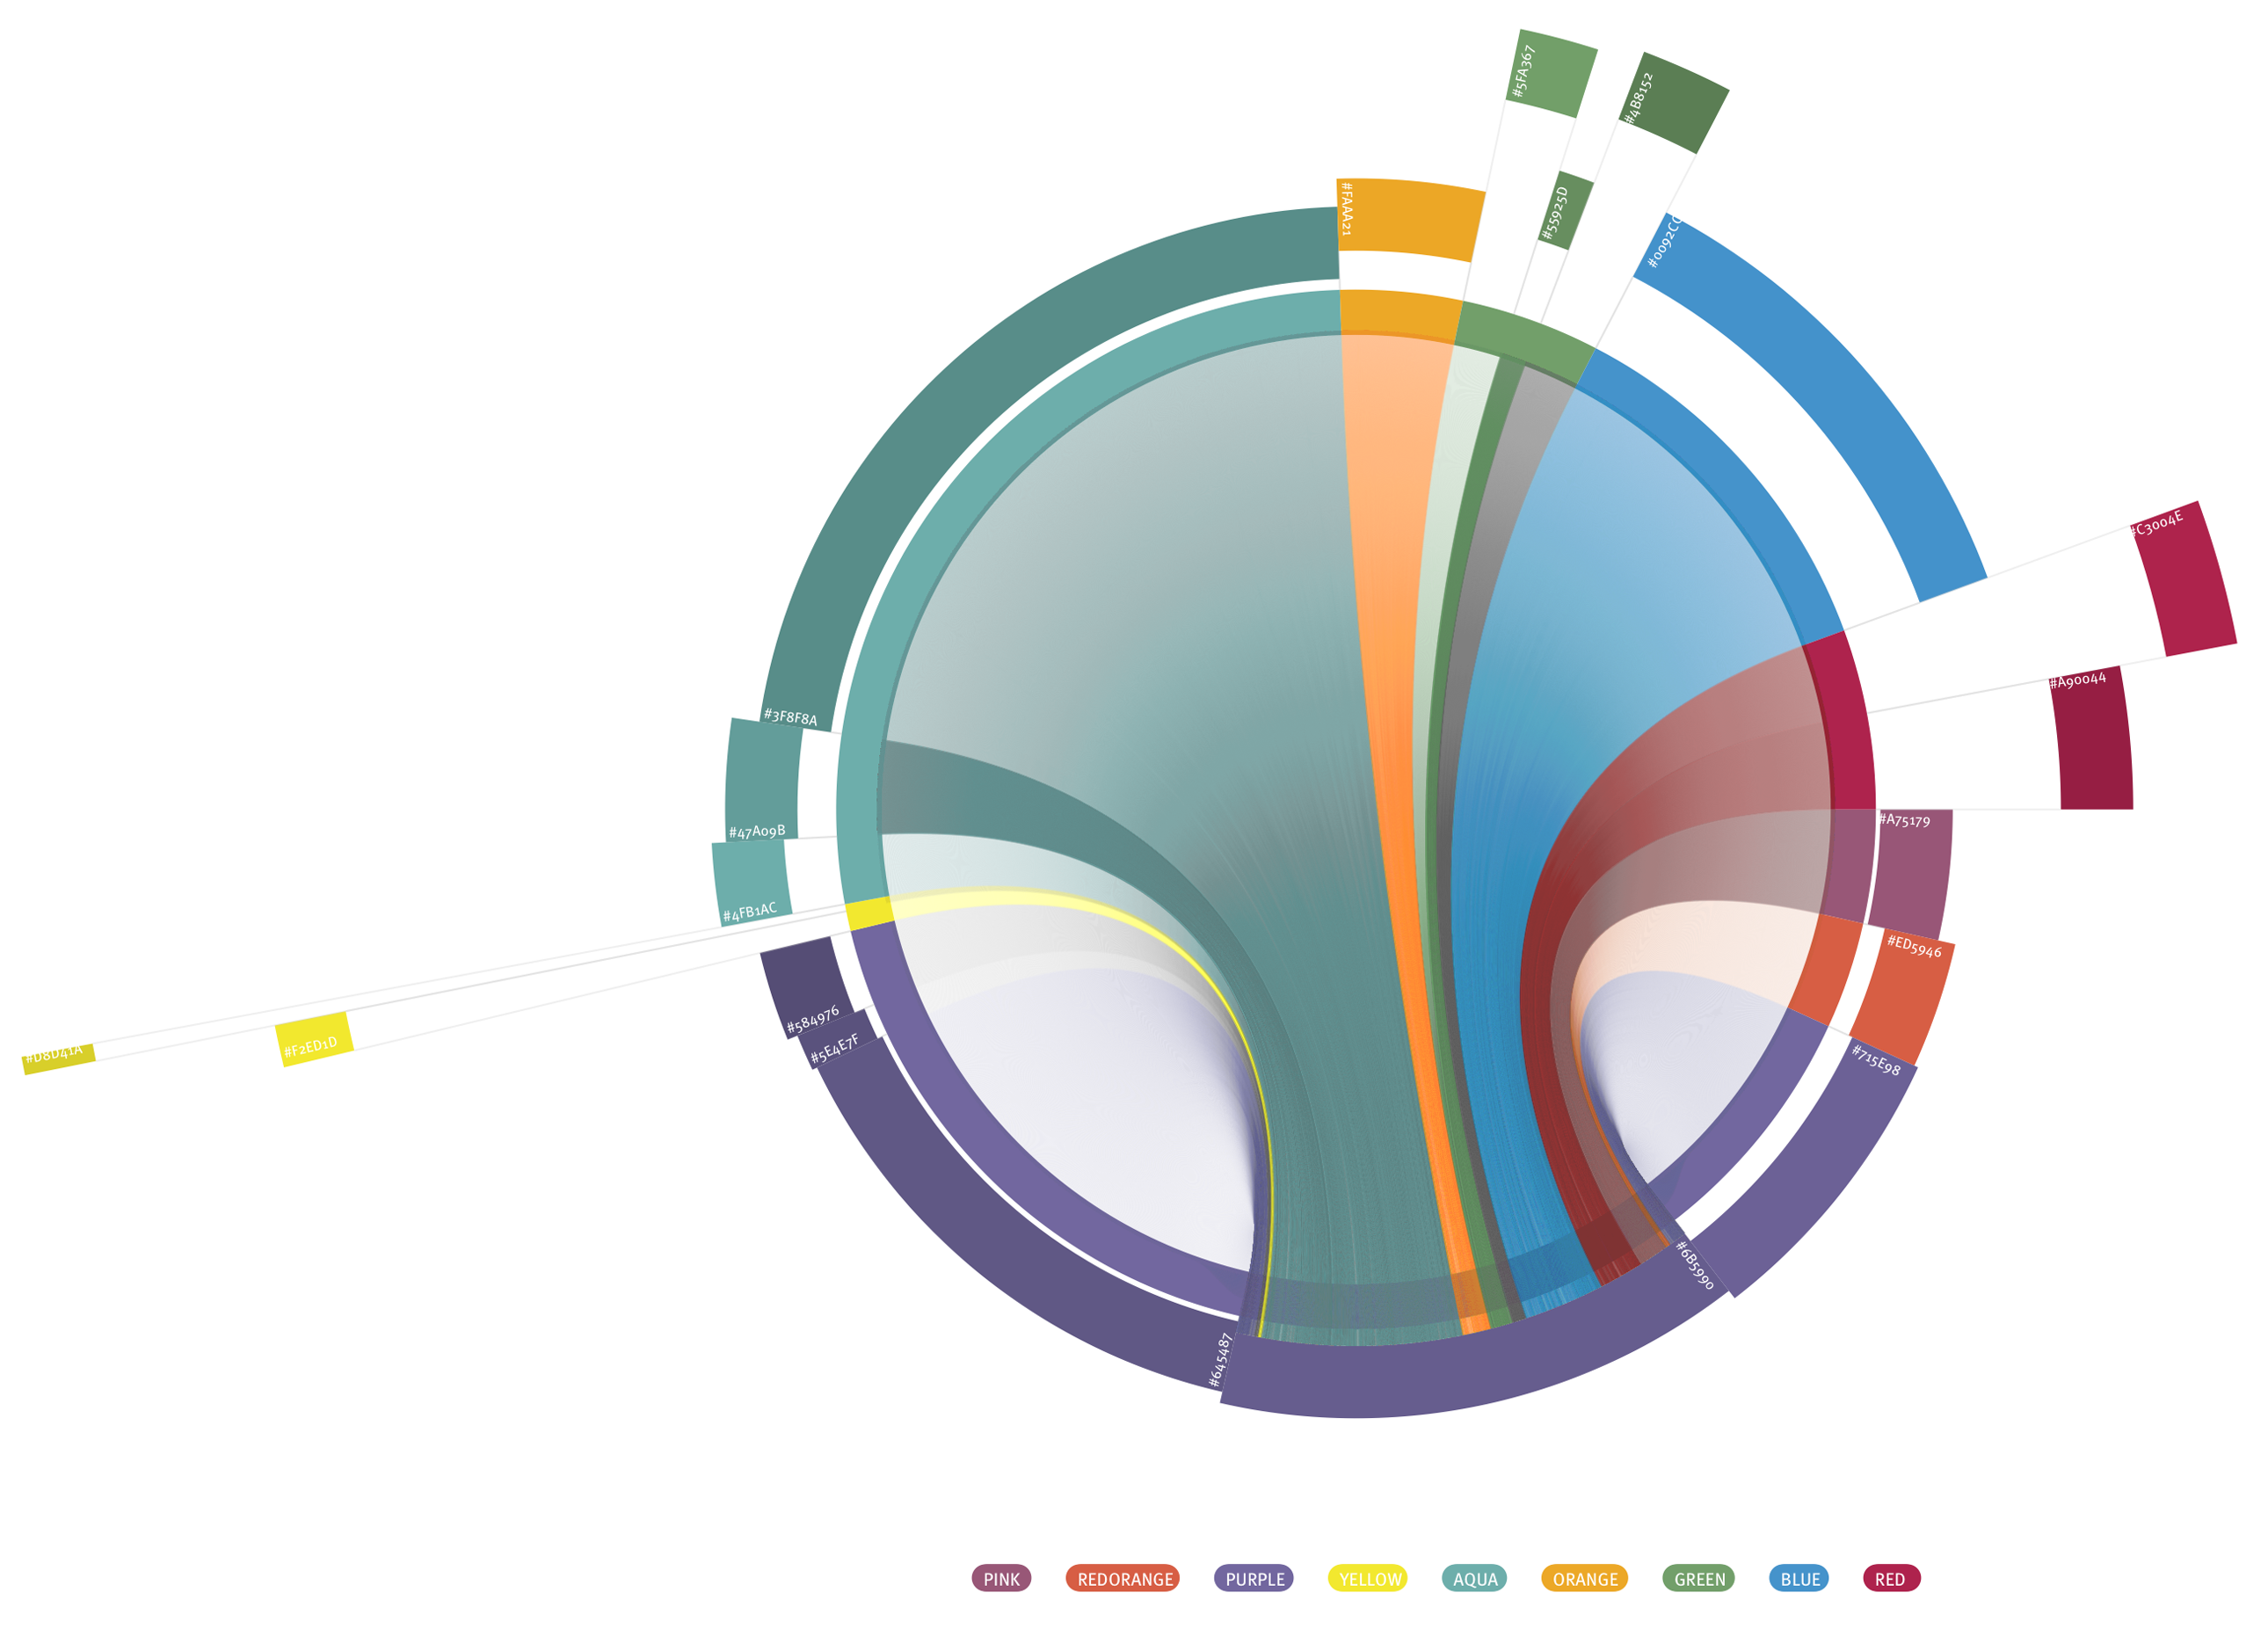
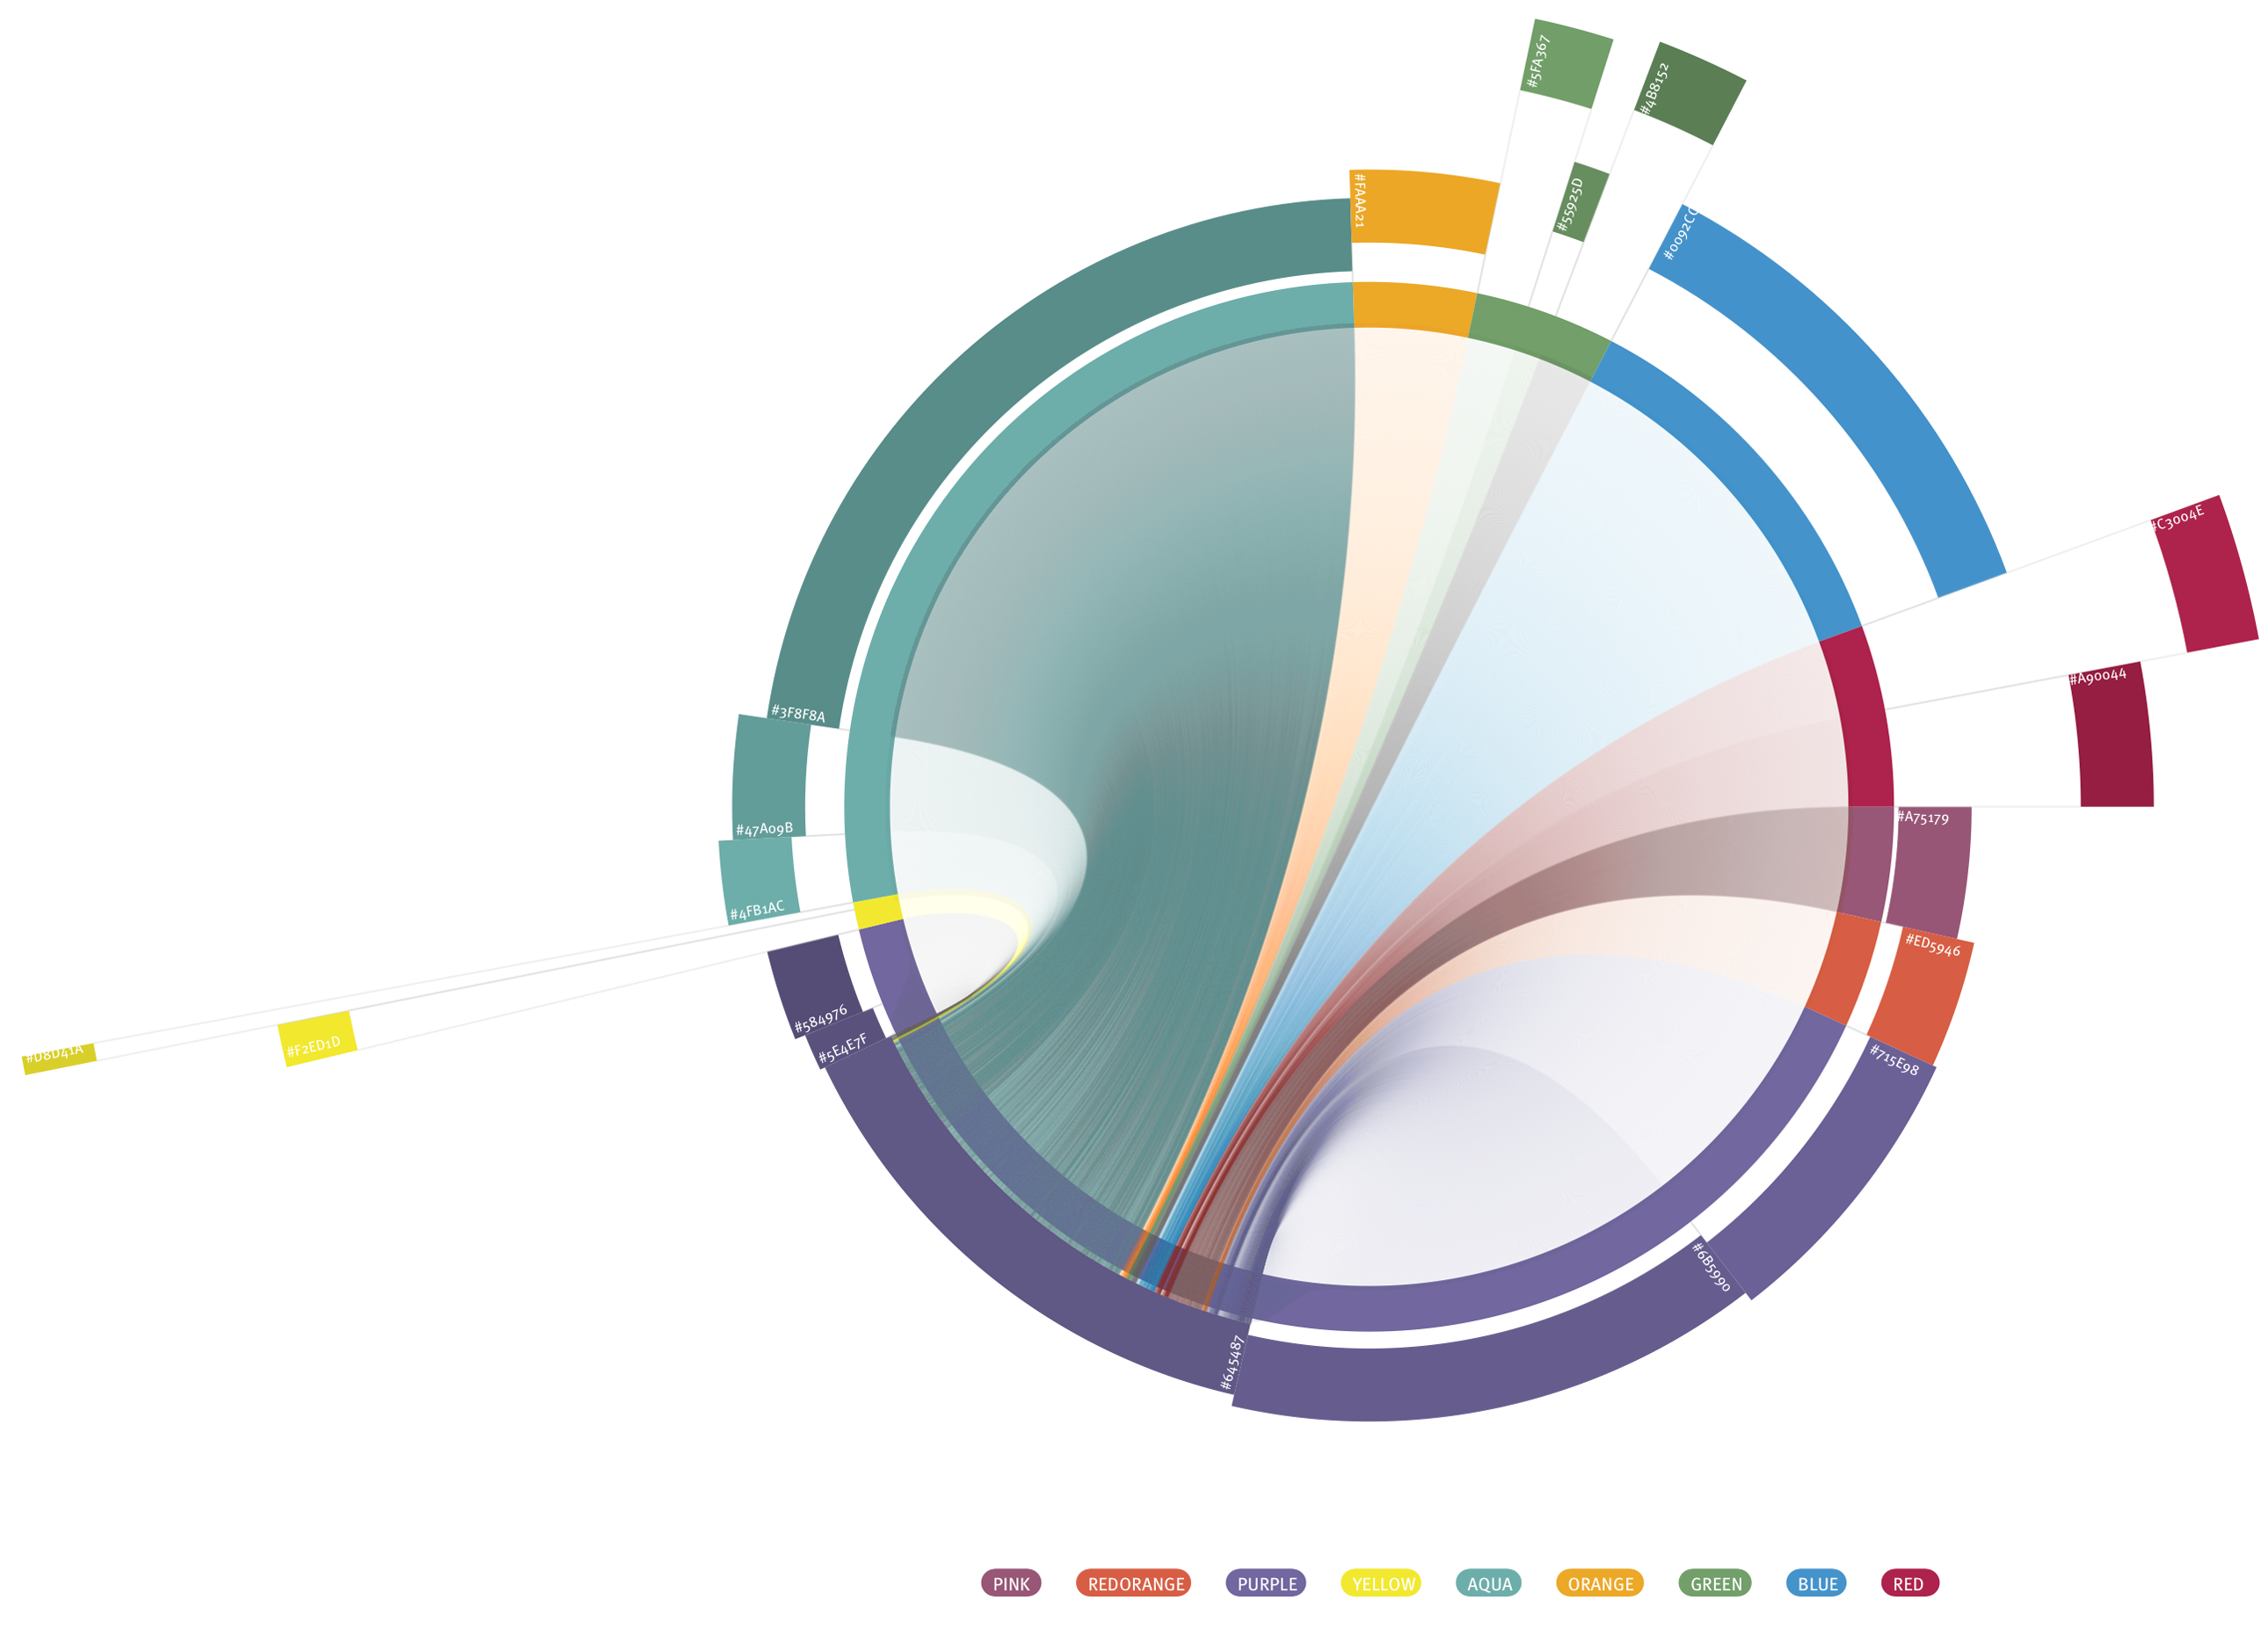
Overview of Diagram: The center ring is a ring chart that shows the percentage of each nation's population in the world of pixels. The outer ring segments represent that state's population in relation to its nation. The distance of the segment from the center ring chart represents the state's GDP (it's wealth). The filling of lines in the center is much like a pie chart, only with an added dimention.
Results: We found surprizingly similar scenarios in our color nations that can behave very much like our nations. We have our small nations with very high wealth like Yellow (think Switzerland) and our poorer, but very large and very heavy trading nations like Purple (think China).
Background on data and diagram: These diagrams were origionally created for a project that we are unable to disclose due to confidentially agreements. The origional data set, consisting of over 14 millions rows of data, has been shuffled and sampled beyond recognition of its orgional form. Searching for a scenario where we could present these diagrams, the Colour Economy seemed a good match. With a degree in International Economics, Wes Grubbs had been intriqued with Thorp's presentation on the Colour Economy from FlashBelt 2007 and eager to explore it himself.
Created by Pitch Interactive (follow us on twitter)
Tools: Processing to create final diagrams, Adobe Illustrator for concept illustrations.