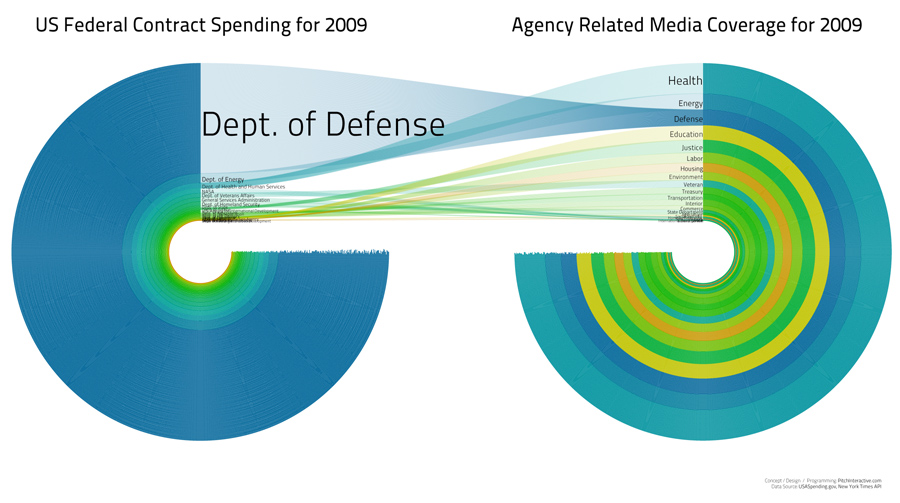
This is our original work
A sans-circle version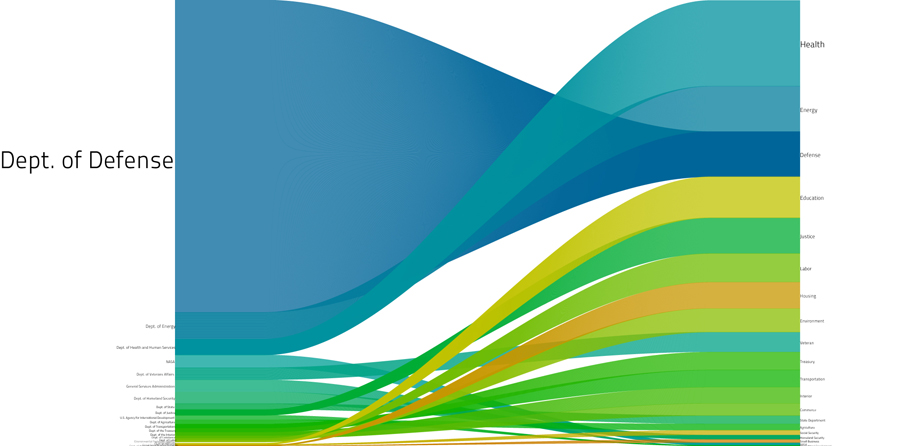
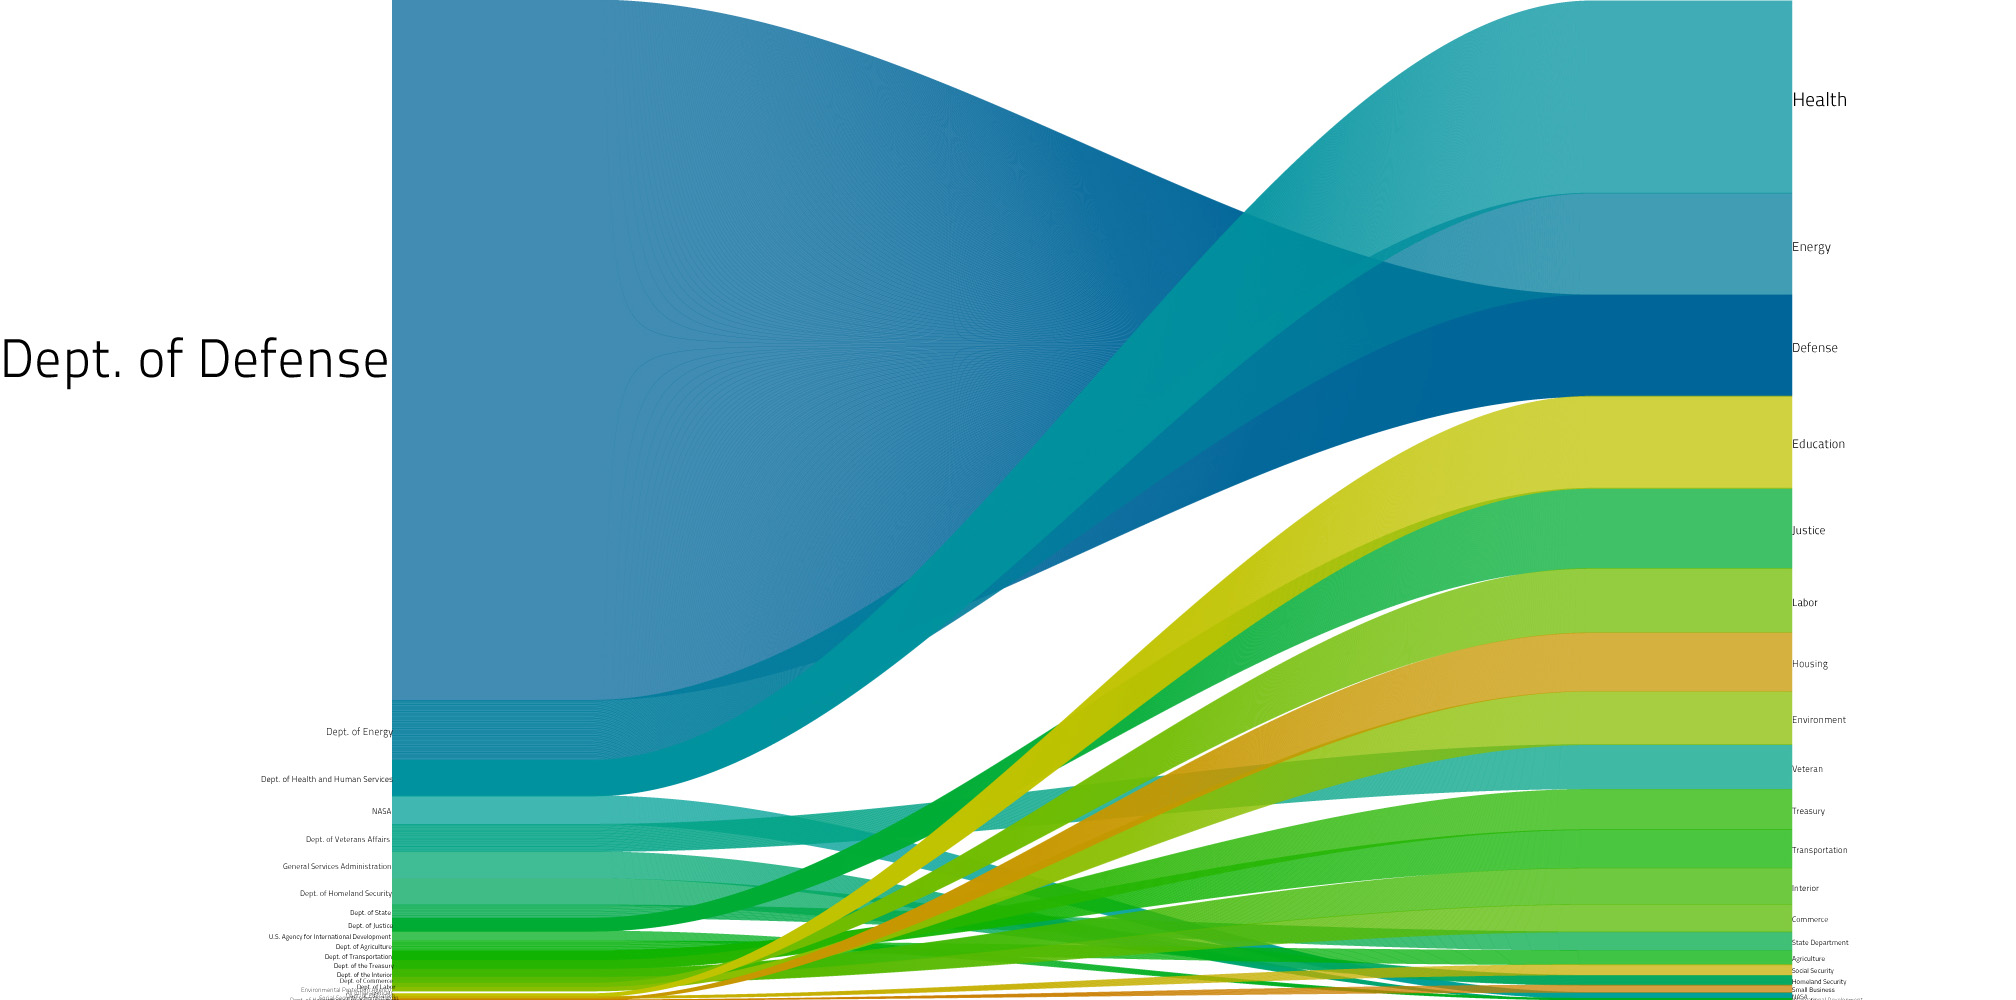
An additional iteration that helps address the overlap and transparency between the connections and labels.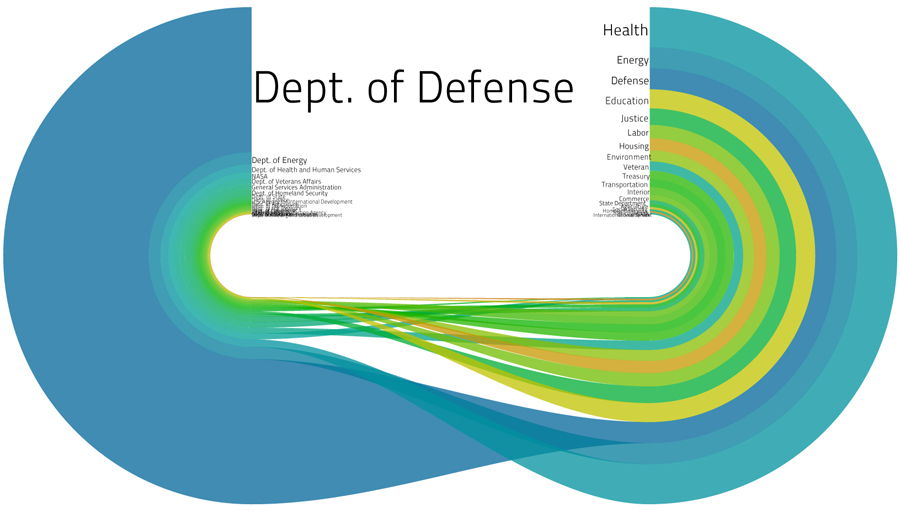
OVERVIEW
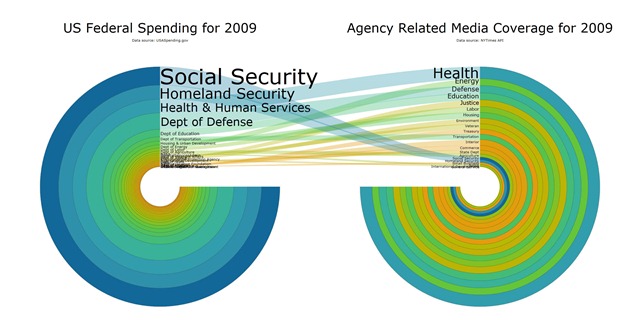
What our government spends vs. how much we talk about it. Two important aspects that help define and shape our society. Most Americans know that our government spends an insane amount of our tax dollars on defense, but how do you show just how much we spend compared to all other areas in our country? We wanted to use a minimal approach with no labeling necessary. The design says it all and shows what almost 70% of Federal contract spending going to defense looks like com paired to all other agencies (Education get's around 1%). For anyone asking for the numbers, scroll down this page. We've added all the data used to create the left visualization above.
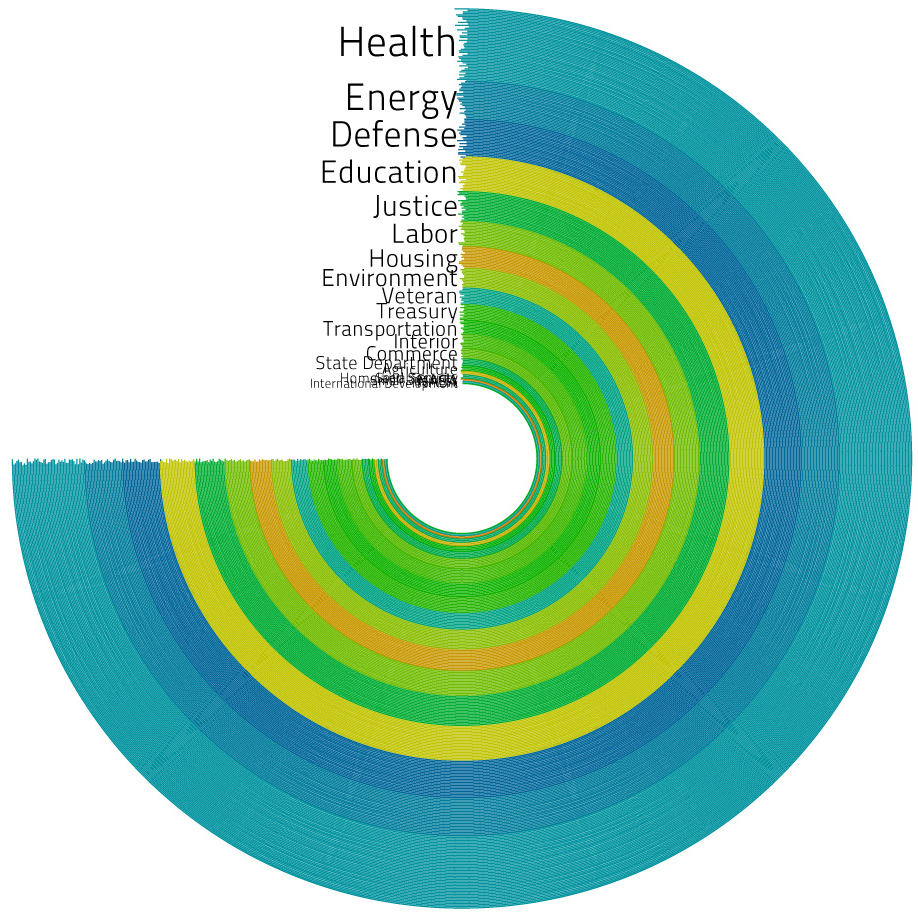
For the right visualization, we used the New York Times API to parse through all articles written in 2009. Using general keywords that dealt with characteristics of each agency, we displayed their frequency usage in comparison with one another. The colors on the right rings are representative of their colors from the left. What we see is that all of the much less-budgeted agencies from the left ring are discussed about far more in our news. The Dept. of Health and Human Services, which was a major issue of discussion in 2009 with health care reform being hotly debated only accounts for about 4% of our federal budget, though it's the most discussed issue in the media.
You can find detailed federal spending data on this page and the results of the NYT API call we made.
Thanks to Political Math (http://www.politicalmathblog.com/) for bringing our attention to an initial assumption we made that was incorrect. We initially implied this
was the entire Federal spending being represented. However, the data gathered from the USASpending.gov API only accounted for contract spending and we corrected this. Apparently, we grabbed the data just before USASpending.gov was relaunched and the interface we used to extract the data implied we were getting everything. The new site is more comprehensive about extracting more types of government spending and is still evolving, so we look forward to grabbing more data from them soon to work with. However, we believe the story of the visualization still holds firm.
Below is an iteration made by Political Math that shows the TOTAL amount of federal spending.
THE STORY
Our focus here was on exploring new ways to visualize government data. Our government spends an insane amount of funds on defense. More than the rest of the world combined. And nearly ALL of the defense budget is contract spending.
What's the problem with contract spending? On one side, contract spending can be good because it allows innovation to be invested in with less goverment red tape to cut through. However, contract spending also removes accountability and lifts the required transparency that government-run programs get. It passes the work and responsibility (that tax dollars pay for) to third-party vendors which do not face the same kind of regulation and oversight present in the government. Knowing that, it's clear that the real innovation dollars goes primarily to defense and also makes clear that the US policy on defense spending is mostly void of transparency that helps us better understand exactly what the government is doing to protect our nation. It's a double-sided sword.
That said, the work we did is still valid for the point we want to make. Below is the process we took for making this work.
THE PROCESS
As with the process of all other visualizations we do, our process was evolutionary. We gather the data, analyze and formulate questions, construct visuals that we are already familiar with (i.e. using established toolsets like bar graphs, line graphs, etc..) and then we explore and refine ways to tell a story with this data in compelling ways.
Because, as a society, we are inherently used to looking at bar graphs and pie charts to examine data (they've been with us for some time), our attempt is to break away from this and explore other ways to gain insight and a broader perspective of the information being visualized. We use design elements and visual aspects that help emphasis the story being told. The visual may be immediately clear to some and make absolutely no sense for others. Because of this, we wanted to illustrate our process in building this visualization and release the source code used to build this.
With this, we hope to see some further improvements to our work or further explorations with the same data to illustrate the insane amount the US government spends on defense and how this relates to media coverage (or something else). Send us your results (info at pitchinteractive.com) and we'll post other explorations here.
Now, how we went about creating this piece:
- Step One: Determine the initial direction to take, formulate questions.
We looked at the USASpending.gov site and started to make initial generic queries on the data available. The result we found was federal [contract] spending by agency with a list of top contractors and top products. This prompted us to first ask just how much the government spends on different agencies. The relation to media coverage came only after we first analyzed the spending. Since the spending seemed disproportionately heavy on just a few agencies, we were curious to try and gauge just how much topics related to these agencies were prevalent in the media.
- Step Two: Gather and parse the data.
Using the API from USASpending.gov, we gathered funding data for all agencies, their respective funding, top products and top contractors.
Download the data we used or query the new USASpending.gov dataset for your own results
For the New York Times Data, you will need to get an Article API Key.
- Step Three: Build basic visualizations to view the data and determine if there's something compelling here to be told.
Our first visualization was a series of bar charts. A larger bar chart (left) that represented all funding for each agency and two subsequent charts that shows the top $ amounts given to contractors (the top right) and products (the bottom right) and we drew lines to connect that contractor/product to it's respective agency:
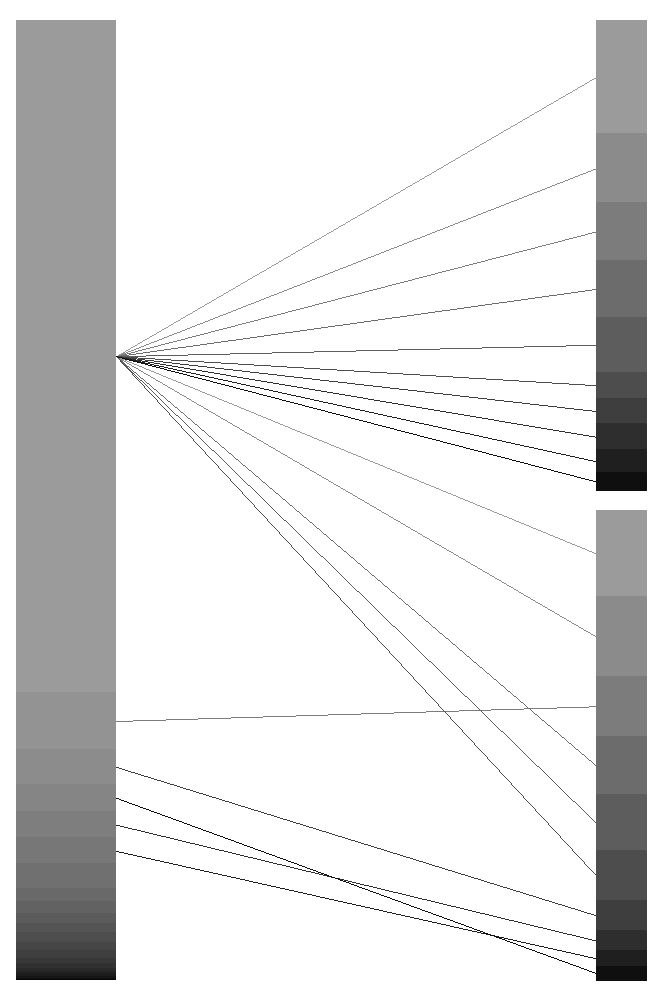
What stood out for us was this dominance the Dept. of Defense had over all other agencies. That alone made the direction we took more focused at this piece of information. It's already obvious that defense being a vast majority of funding would mean they dominate the contractor and product lists.
Our next step was then to focus on a bigger picture and ways to show this dominance in spending for defense. At the same time, we were curious just how much dominance these agencies have in our daily lives. Using the NYT API, we queried general words for each agency to see how often this topic was brought up. An imperfect approach, but useful in formulating a very simple measurement. We had considered using a list of words for each agency, but decided that this would overcomplicate the process and deviate from an initial gauge at the relationships we wanted to determine.
This is the result of stylizing the agency allocation graph in relation to the media coverage:
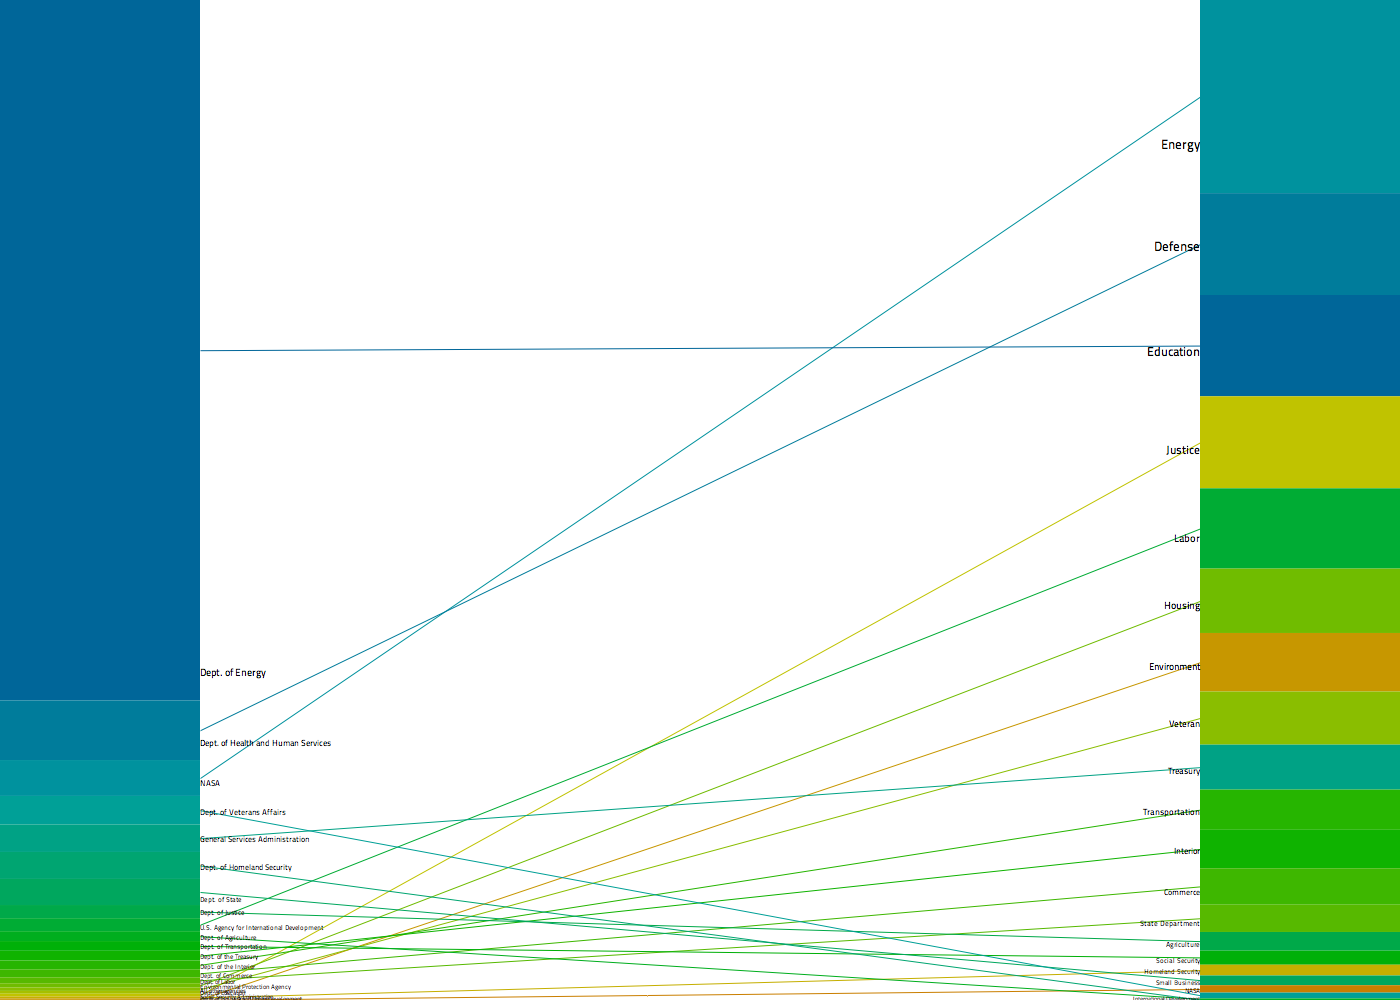
What we discovered in this visualization was that, while government contract expenditures seem skewed toward a few agencies (especially Defense), our media coverage was far more evenly distributed. And this was the story we wanted to underscore. What were other ways to portray this information in an engaging format that draws the viewer and evokes them to
explore this information.
- Step Four: Beyond the bar chart: Explore new ways to represent this data
Up to now, the processes and methodologies we've used have been pretty standard. From here, we break away to portray this data and dig deeper with design elements to add visual meanings and associations. Design evokes emotion and with "decorative" elements, we attempt to emphasis on a visual story.
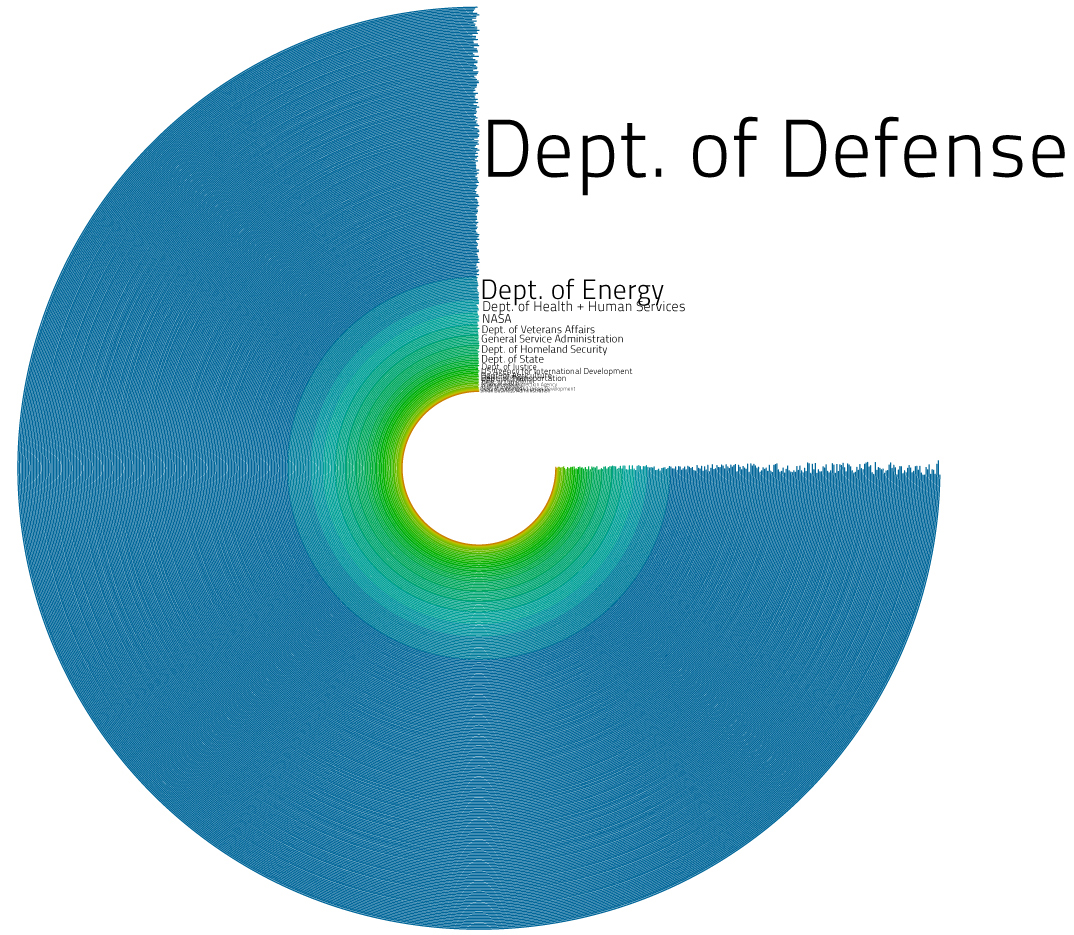
The use of the circlular shapes was, in part, to strengthen the visual relationship between both rings by creating a "visual momentum" that the eye follows from one side to another. The other message we wanted to convey is that not matter how you look at this (i.e. no matter what angle)
you will still find the same message, which is the overbearing and unequivocal support for defense.
Below are both rings by themselves to show how they look individually followed by a link to the source code used to generate this.
US Federal Contract Spending
New York Times, word frequency in all articles for 2009
Now that you've seen the process, download the source code for this and play with it.
THE USASPENDING.GOV DATA
Dept. of Defense
$3.6587212E11 = 69% of Total Federal Contract Spending
Top Products:
Aircraft, Fixed Wing: $1.73750231E10
Liquid Propellants and Fuels, Petroleum Base: $1.58774405E10
General Health Care Services: $1.17113641E10
Engineering and Technical Services: $1.12156467E10
Logistics Support Services: $9.8211389E9
Top Contractors:
Lockheed Martin Corporation: $3.12430182E10
The Boeing Company: $1.87836436E10
General Dynamics Corporation: $1.58950113E10
Northrop Grumman Corporation: $1.56351549E10
Raytheon Company: $1.50079109E10
United Technologies Corporation: $7.1396664E9
L-3 Communications Holdings, Inc.: $7.0586696E9
Bae Systems PLC: $7.056514E9
Oshkosh Corporation: $6.3790679E9
Kbr, Inc.: $4.6839895E9
Dept. of Energy
$3.11515914E10 = 5% of Total Federal Contract Spending
Top Products:
Operation of Government-Owned Facilities -- Government-Owned Contractor-Operated (GOCO) R&D Facilities: $1.20102318E10
Operation of Government-Owned Facilities -- Other Industrial Buildings: $2.65022669E9
Maintenance, Repair or Alteration of Real Property -- Waste Treatment and Storage Facilities: $1.8931913E9
Operation of Government-Owned Facilities -- Restoration of real property: $1.79561242E9
Other Research and Development -- Basic Research (R&D): $1.51674586E9
Top Contractors:
Ch2m Hill Companies, Ltd.: $2.63905075E9
Lockheed Martin Corporation: $2.50204109E9
Los Alamos National Security LLC: $2.48256307E9
URS Corporation: $2.3693632E9
Savannah River Nuclear Solutions, Lls: $2.2338944E9
Bechtel Group, Inc.: $1.99093005E9
Battelle Memorial Institute Inc: $1.73980326E9
Ut-Battelle, LLC: $1.67300877E9
Lawrence Livermore National Security, LLC: $1.49296614E9
Alliance For Sustainable Energy, LLC: $9.1417242E8
Dept. of Health and Human Services
$1.87525571E10 = 3% of Total Federal Contract Spending
Top Products:
Drugs and Biologicals: $6.1115571E9
Other Professional Services: $1.20042189E9
Other ADP and Telecommunications Services (includes data storage on tapes, compact disks, etc.): $9.1112384E8
Operation of Government-Owned Facilities -- Government-Owned Contractor-Operated (GOCO) R&D Facilities: $7.6480781E8
Biomedical -- Basic Research (R&D): $6.947495E8
Top Contractors:
Novartis AG: $1.54203558E9
Schering-Plough Corporation: $1.35109722E9
Sanofi Pasteur Msd SNC: $1.23724045E9
Setfirst Ltd: $9.3262573E8
Saic, Inc.: $8.1609133E8
Pfizer Inc.: $6.7854982E8
Astrazeneca PLC: $4.5252E8
Westat, Inc.: $3.20836736E8
Blue Cross and Blue Shield of South Carolina: $3.18217504E8
Lockheed Martin Corporation: $2.68467392E8
NASA
$1.48674785E10 = 2% of Total Federal Contract Spending
Top Products:
Engineering and Technical Services: $2.77180109E9
Space Science and Applications -- Applied Research and Exploratory Development (R&D): $2.14263258E9
Space Flight -- Advanced Development (R&D): $1.03764813E9
Space Vehicle Components: $5.835433E8
R&D-Space Station-A Res/Exp Dev: $5.753593E8
Top Contractors:
Lockheed Martin Corporation: $1.92408602E9
Government of The United States: $1.77287565E9
United Space Alliance, LLC: $1.523344E9
The Boeing Company: $1.09050112E9
Alliant Techsystems Inc.: $7.1006931E8
Jacobs Engineering Group Inc.: $6.938224E8
United Technologies Corporation: $4.49149376E8
SPACE-RUS OOO: $3.87192256E8
Northrop Grumman Corporation: $3.732592E8
Saic, Inc.: $3.72922048E8
Dept. of Veterans Affairs
$1.44018586E10 = 2% of Total Federal Contract Spending
Top Products:
Drugs and Biologicals: $3.98116019E9
Medical and Surgical Instruments, Equipment, and Supplies: $1.26900378E9
Maintenance, Repair or Alteration of Real Property -- Hospitals and Infirmaries: $6.6329338E8
Construction of Structures and Facilities -- Hospitals and Infirmaries: $5.88408E8
X-Ray Equipment and Supplies: Medical, Dental, Veterinary: $4.41611232E8
Top Contractors:
McKesson Corporation: $3.86514842E9
Koninklijke Philips Electronics N.V.: $2.07463504E8
Siemens AG: $2.06764048E8
Cardinal Health, Inc.: $1.68208736E8
General Electric Company: $1.45126576E8
Microtechnologies LLC: $1.0189704E8
Sonova Holding AG: $9.8622856E7
Dell Inc.: $9.395228E7
P.J. Dick Incorporated: $7.640556E7
Clark Enterprises, Inc.: $7.3994272E7
General Services Administration
$1.40951736E10 = 2% of Total Federal Contract Spending
Top Products:
Lease or Rental of Facilities -- Office Buildings: $3.13462451E9
Trucks and Truck Tractors, Wheeled: $1.64608026E9
Maintenance, Repair or Alteration of Real Property -- Office Buildings: $1.58638592E9
Construction of Structures and Facilities -- Office Buildings: $1.06440781E9
Other ADP and Telecommunications Services (includes data storage on tapes, compact disks, etc.): $9.257257E8
Top Contractors:
General Motors Company: $6.9565498E8
Ford Motor Company: $4.82716608E8
Clark Enterprises, Inc.: $4.46942016E8
Saic, Inc.: $3.68067072E8
Wgl Holdings, Inc.: $3.52354208E8
Chrysler Group LLC: $2.66994544E8
Cauldwell-Wingate Company, LLC: $2.268776E8
EDS Handyman Service: $2.15475952E8
National Industries For The Blind: $1.78231408E8
Northrop Grumman Corporation: $1.7764128E8
Dept. of Homeland Security
$1.36225065E10 = 2% of Total Federal Contract Spending
Top Products:
Guard Services: $1.19677837E9
Other ADP and Telecommunications Services (includes data storage on tapes, compact disks, etc.): $9.3647251E8
Other Professional Services: $8.6075661E8
Program Management/Support Services: $8.387744E8
Engineering and Technical Services: $5.6889882E8
Top Contractors:
International Business Machines Corporation: $5.12400704E8
Lockheed Martin Corporation: $4.28434688E8
Integrated Coast Guard Systems LLC: $3.81267424E8
General Dynamics Corporation: $3.57664448E8
Computer Sciences Corporation: $3.41459328E8
Accenture Public Limited Company: $3.31858336E8
Saic, Inc.: $3.1589216E8
Booz Allen Hamilton Inc.: $2.88069728E8
L-3 Communications Holdings, Inc.: $2.70268992E8
Unisys Corporation: $2.61989392E8
Dept. of State
$6.8628567E9 = 1% of Total Federal Contract Spending
Top Products:
Other Professional Services: $1.42955712E9
Guard Services: $1.02035949E9
Construction of Structures and Facilities -- Office Buildings: $9.2357523E8
Other ADP and Telecommunications Services (includes data storage on tapes, compact disks, etc.): $3.03137408E8
Other Administrative Support Services: $2.6892176E8
Top Contractors:
Dyncorp International Inc.: $1.1431392E9
Triple Canopy Inc: $4.30963904E8
B.L. Harbert Holdings, L.L.C.: $2.686448E8
U.S. Training Center, Inc.: $2.39933904E8
Environmental Chemical Corporation: $2.09392448E8
Pae Government Services, Inc.: $1.54572864E8
MISCELLANEOUS FOREIGN CONTRACTORS: $1.24295136E8
Framaco International Inc.: $1.17835256E8
ZAFER TAAHHUT INSAAT VE TICARET A S: $1.10744048E8
Northrop Grumman Corporation: $1.09528416E8
Dept. of Justice
$6.7945779E9 = 1% of Total Federal Contract Spending
Top Products:
Social Rehabilitation Services: $5.11412352E8
ADP Systems Development Services: $4.32924352E8
Other ADP and Telecommunications Services (includes data storage on tapes, compact disks, etc.): $4.11256448E8
Construction of Structures and Facilities -- Penal Facilities: $3.74752512E8
Guard Services: $2.84245056E8
Top Contractors:
Corrections Corporation of America: $3.69197696E8
Lockheed Martin Corporation: $3.25089888E8
Small Business Consolidated Reporting: $2.30507568E8
Bulletin News Network, Inc.: $2.165792E8
Yates Caddell Joint Venture: $1.75740992E8
Akal Security, Inc: $1.70037488E8
Hensel Phelps Construction Co: $1.6304272E8
Forfeiture Support Associates LLC: $1.26883584E8
World Wide Technology Holding Co., Inc.: $1.00083152E8
Caci International Inc: $9.3335024E7
U.S. Agency for International Development
$5.1707484E9 = 1% of Total Federal Contract Spending
Top Products:
Technical Assistance: $2.13979085E9
Education Services: $7.1095059E8
Other Professional Services: $5.7208794E8
Miscellaneous Items: $1.89943536E8
Other Management Support Services: $1.77355296E8
Top Contractors:
Bearingpoint, Inc.: $8.5988723E8
Chemonics International, Inc: $4.8363008E8
Management Systems International, Inc: $3.6405936E8
John Snow, Incorporated: $3.35404032E8
Berger Group Holdings Inc: $3.06511424E8
Partnership For Supply Chain Management, Inc.: $2.8942288E8
Development Alternatives, Inc.: $2.31637408E8
Creative Associates International, Inc.: $1.93902592E8
Tetra Tech, Inc.: $1.66902832E8
Research Triangle Institute Inc: $1.60340176E8
Dept. of Agriculture
$5.0829107E9 = 1% of Total Federal Contract Spending
Top Products:
Meat, Poultry, and Fish: $8.440185E8
Fruits and Vegetables: $6.1845645E8
Bakery and Cereal Products: $3.75607296E8
Miscellaneous Crude Agricultural and Forestry Products: $3.47275936E8
Dairy Foods and Eggs: $3.2762208E8
Top Contractors:
Cargill Incorporated: $1.56881056E8
Archer Daniels Midland Company: $1.19920536E8
Tyson Foods, Inc.: $1.01309992E8
Land O'Lakes, Inc.: $9.9711136E7
Leprino Foods Company: $9.8916184E7
Bunge Limited: $9.2086064E7
Hormel Foods Corporation: $8.9843712E7
Cal Western Packaging Corp: $8.8801528E7
Didion, Inc: $8.844496E7
ZMF Fundo de Investimento em Participa??es.: $8.4561568E7
Dept. of Transportation
$5.0613637E9 = 1% of Total Federal Contract Spending
Top Products:
Engineering and Technical Services: $6.8252122E8
Construction of Structures and Facilities -- Highways, Roads, Streets, Bridges, and Railways (includes resurfacing): $5.12517312E8
Miscellaneous Items: $4.26161536E8
Operation of Government-Owned Facilities -- Other Non-Building Facilities: $2.753488E8
Other Administrative Support Services: $2.25273984E8
Top Contractors:
Lockheed Martin Corporation: $6.0617715E8
Harris Corporation: $2.4404424E8
Raytheon Company: $2.05017408E8
ITT Corporation: $1.94665088E8
The Mitre Corporation: $1.65030352E8
Computer Sciences Corporation: $1.36216608E8
Bombardier Inc: $9.2623848E7
Northrop Grumman Corporation: $8.3850288E7
Crowley Maritime Corporation: $8.270796E7
Washington Metropolitan Area Transit Authority: $7.6850224E7
Dept. of the Treasury
$4.5995832E9 = < 1% of Total Federal Contract Spending
Top Products:
Precious Metals Primary Forms: $1.58015654E9
Other ADP and Telecommunications Services (includes data storage on tapes, compact disks, etc.): $5.8515315E8
ADP Software: $1.94892608E8
Paper and Paperboard: $1.33563128E8
ADP Telecommunications and Transmission Services: $1.26943312E8
Top Contractors:
Spectrum Group International, Inc.: $9.2532429E8
Sunshine Minting, Inc.: $3.48011136E8
Mitsui & Co. Precious Metals, Inc.: $1.98787088E8
Computer Sciences Corporation: $1.40929872E8
Northrop Grumman Corporation: $1.36326448E8
Crane & Co., Inc.: $1.2921416E8
Accenture Public Limited Company: $9.9721672E7
Booz Allen Hamilton Inc.: $9.4005928E7
Lockheed Martin Corporation: $8.9285984E7
International Business Machines Corporation: $7.7617944E7
Dept. of the Interior
$4.17764122E9 = < 1% of Total Federal Contract Spending
Top Products:
Mental Health -- Management and Support (R&D): $3.05201792E8
Other ADP and Telecommunications Services (includes data storage on tapes, compact disks, etc.): $1.81018928E8
Other Professional Services: $1.533948E8
Construction of Structures and Facilities -- Canals: $1.44132016E8
Other Research and Development -- Management and Support (R&D): $1.12332928E8
Top Contractors:
Health Net, Inc.: $3.05201792E8
Booz Allen Hamilton Inc.: $1.21045904E8
A Ames/Csi Joint Venture: $1.0010848E8
Dell Inc.: $8.6352576E7
Saic, Inc.: $8.284908E7
International Business Machines Corporation: $7.3157192E7
Foundation Holdings, Inc.: $7.110168E7
Martin Brothers Construction: $6.2005408E7
United Solutions and Services LLC: $6.0411452E7
Northrop Grumman Corporation: $3.576262E7
Dept. of Commerce
$3.10854221E9 = < 1% of Total Federal Contract Spending
Top Products:
Other ADP and Telecommunications Services (includes data storage on tapes, compact disks, etc.): $4.4296336E8
Other Professional Services: $3.91454432E8
Services -- Operational Systems Development (R&D): $2.56667248E8
Advertising Services: $2.0328072E8
ADP Systems Development Services: $1.38316416E8
Top Contractors:
Harris Corporation: $3.77657824E8
Lockheed Martin Corporation: $2.59481408E8
The Interpublic Group of Companies Inc: $2.03207936E8
International Business Machines Corporation: $1.26371184E8
Reed Elsevier Group PLC: $7.1110504E7
Raytheon Company: $7.0597208E7
Ics Nett, Inc.: $5.2591576E7
Saic, Inc.: $4.5839352E7
Earth Resources Technology, Inc.: $4.4559688E7
Nana Regional Corporation, Inc.,: $4.076462E7
Dept. of Labor
$2.24600218E9 = < 1% of Total Federal Contract Spending
Top Products:
Operation of Government-Owned Facilities -- Other Educational Buildings: $6.9389389E8
Vocational/Technical: $4.25916352E8
Other Professional Services: $3.05555232E8
Lease or Rental of Facilities -- Other Educational Buildings: $8.1998808E7
Financial Services (includes credit card services and any other financial services. See revision to description for code R703 above): $5.7803604E7
Top Contractors:
Management & Training Corporation: $3.26540096E8
RES-Care, Inc.: $1.50804944E8
Adams and Associates, Inc: $1.12128368E8
Y W C A of Greater Los Angeles Inc: $1.03978288E8
Minact Inc: $9.2314536E7
Owl Companies: $8.0998E7
Endless Horizons, Inc.: $5.109776E7
Fluor Corporation: $4.4166792E7
Chugach Alaska Corporation: $3.9648524E7
Exodyne, Inc: $3.7186472E7
Environmental Protection Agency
$1.7527895E9 = < 1% of Total Federal Contract Spending
Top Products:
Architect - Engineer Services (including landscaping, interior layout, and designing): $2.05764032E8
Hazardous Substance Removal, Cleanup, and Disposal Services and Operational Support: $1.9877608E8
A&E Management Engineering Services: $1.398784E8
Other Professional Services: $9.739804E7
Technical Assistance: $7.7428288E7
Top Contractors:
Ch2m Hill Companies, Ltd.: $1.52805952E8
Camp Dresser & McKee Inc.: $6.4576008E7
Sultrac, JV: $6.3632168E7
Computer Sciences Corporation: $6.0532884E7
Tetra Tech, Inc.: $5.2445388E7
Lockheed Martin Corporation: $4.8473336E7
Hydrogeologic, Inc.: $4.7961212E7
Environmental Restoration, LLC: $4.6350072E7
Environmental Quality Management, Inc.: $4.536732E7
Sra International, Inc.: $4.1010348E7
All other agencies
$1.46722611E9 = < 1% of Total Federal Contract Spending
Top Products:
Other Professional Services: $9.51136E7
Other ADP and Telecommunications Services (includes data storage on tapes, compact disks, etc.): $8.8824128E7
Construction of Structures and Facilities -- Sewage and Waste Facilities: $8.7692464E7
ADP Systems Development Services: $7.456784E7
Maintenance, Repair or Alteration of Real Property -- Museums and Exhibition Buildings: $6.6123204E7
Top Contractors:
Lockheed Martin Corporation: $9.0540816E7
PCL Employees Holdings Ltd: $8.7692464E7
Government of The United States: $4.1405572E7
Teletech Holdings, Inc.: $2.8387504E7
Computech, Inc.: $2.837776E7
S & B Engineers and Constructors, Inc: $2.369694E7
L-3 Communications Holdings, Inc.: $1.9813954E7
Longhorn Excavators Inc: $1.916916E7
MISCELLANEOUS FOREIGN CONTRACTORS: $1.6006925E7
Dell Inc.: $1.5984682E7
Dept. of Education
$1.42634982E9 = < 1% of Total Federal Contract Spending
Top Products:
Banking Services(includes accepting and cashing government checks and other payment instruments, accepting direct deposits, accepting payments to the government from the public such as excise taxes and duties, maintaining bank accounts): $2.52307376E8
Equipment and Materials Testing -- Automatic Data Processing Equipment (Including Firmware), Software, Supplies and Support Equipment: $2.2960968E8
ADP Facility Operation and Maintenance Services: $1.19082624E8
Data Analyses (other than scientific): $1.04733432E8
Education -- Basic Research (R&D): $9.9344952E7
Top Contractors:
Xerox Corporation: $2.29995248E8
Westat, Inc.: $9.4813912E7
Accenture Public Limited Company: $8.8841744E7
Veritas Capital Fund II, L.P.: $7.0054224E7
SLM Corporation: $4.712756E7
American Institutes For Research In The Behavioral Sciences: $4.2069392E7
Jpmorgan Chase & Co.: $3.5360892E7
Mathematica, Inc.: $3.3011384E7
Van Ru Credit Corporation: $3.1201458E7
Dell Inc.: $3.047368E7
Social Security Administration
$1.03578752E9 = < 1% of Total Federal Contract Spending
Top Products:
ADP Software: $2.326948E8
Other ADP and Telecommunications Services (includes data storage on tapes, compact disks, etc.): $1.25859344E8
ADP Input/Output and Storage Devices: $8.9237464E7
ADP Support Equipment: $6.4333208E7
ADPE System Configuration: $6.0162856E7
Top Contractors:
International Business Machines Corporation: $1.41112016E8
Dell Inc.: $6.3107684E7
Vion Corporation: $6.0611652E7
Hewlett-Packard Company: $5.7847644E7
PC Mall Gov Inc: $4.144888E7
Ca, Inc.: $3.4242968E7
Prudential Financial, Inc.: $3.1693268E7
Microtechnologies LLC: $2.844275E7
Compuware Corporation: $2.8436298E7
Nana Regional Corporation, Inc.,: $2.8226502E7
Dept. of Housing and Urban Development
$7.3948339E8 = < 1% of Total Federal Contract Spending
Top Products:
Other Professional Services: $1.30296416E8
Real Estate Brokerage Services: $9.0284864E7
Automated Information System Design and Integration Services: $8.4217936E7
ADP Facility Operation and Maintenance Services: $6.5040208E7
Housing -- Management and Support (R&D): $4.7488876E7
Top Contractors:
Lockheed Martin Corporation: $7.5178504E7
EDS Handyman Service: $6.5075096E7
Michaelson, Connor & Boul: $5.9824192E7
Harrington, Moran, Barksdale, Inc.: $5.1077536E7
Deloitte LLP: $2.7485072E7
Southwest Alliance of Asset Managers D6 LLC: $2.277595E7
Southwest Alliance of Asset Managers D5, LLC: $2.1122492E7
Ats Corporation: $1.9093676E7
Dynaxys, LLC: $1.760808E7
Quality Software Services, Inc.: $1.3537685E7
Small Business Administration
$8.6914512E7 = < 1% of Total Federal Contract Spending
Top Products:
Other Professional Services: $2.3463966E7
Program Management/Support Services: $6641892.0
Credit Reporting Services: $5728250.5
Computer Aided Design/Computer Aided Manufacturing (CAD/CAM) Services: $5463424.5
Programming Services: $5075431.5
Top Contractors:
Sra International, Inc.: $8854629.0
The Dun & Bradstreet Corporation: $5723587.5
Trusted Mission Solutions Inc.: $5530153.5
Northern Taiga Ventures, Inc.: $4880231.5
Ahmad Associates, Limited, A Professional Corporation: $4660252.5
Unisys Corporation: $3419209.8
Digital Management, Inc.: $2815325.5
KPMG L.L.P.: $2494201.0
Verizon Communications Inc.: $2107356.0
Prism Communications, Inc.: $175040< 1% of Total Federal Contract Spending
To try and determine how each agency above were represented in the media, we used a very simple approach: Search through all articles
written by the New York Times in 2009 using their API using a general keyword that was related to the agency and group all usage of this word and then compair its
frequency to the other words used to relate to other agencies. Basicaly, trying to determine how
often the issues related to that agency are discussed go get a sense for how important our media sees this. Unfortunaly, the NYT API does
not contain the entire article and there is no other reliable US Newspaper source with an API that comes close to NYT's, so these results are
subject to debate. Regardless, the point was to have an idea with this simple approach.